Breakoutwatch Weekly Summary 03/04/2024
You are receiving this email because you are or were a
BreakoutWatch.com subscriber, or have subscribed to our weekly
newsletter.
To read this newsletter on the site, click here: Newsletter
.
Market Summary
Stocks end mostly higher following favorable inflation news
Most of the major benchmarks ended the week higher, with the Nasdaq Composite joining the S&P 500 Index in record territory for the first time in over two years. The month also closed a strong February, with the S&P 500 marking its strongest beginning two months of the year since 2019, according to The Wall Street Journal. The week’s gains were also broad-based, with an equal-weighted version of the S&P 500 Index modestly outperforming its more familiar market capitalization version. For the year-to-date period, however, the capitalization-weighted version of the index remained ahead by 409 basis points (4.09 percentage points), reflecting the outperformance of large, technology-oriented growth stocks. [more...]
Major Index Performance
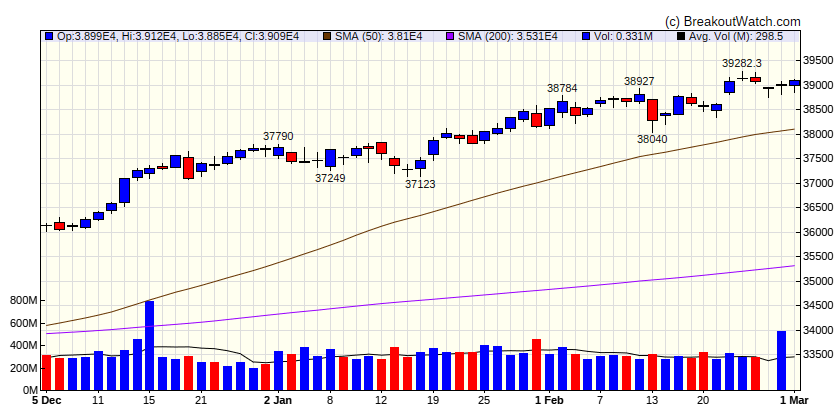
| Dow Jones
|
| Last Close
| 39087 |
| Wk. Gain
| -0.15 % |
| Yr. Gain
| 4.05 % |
| Trend
| Up |
|
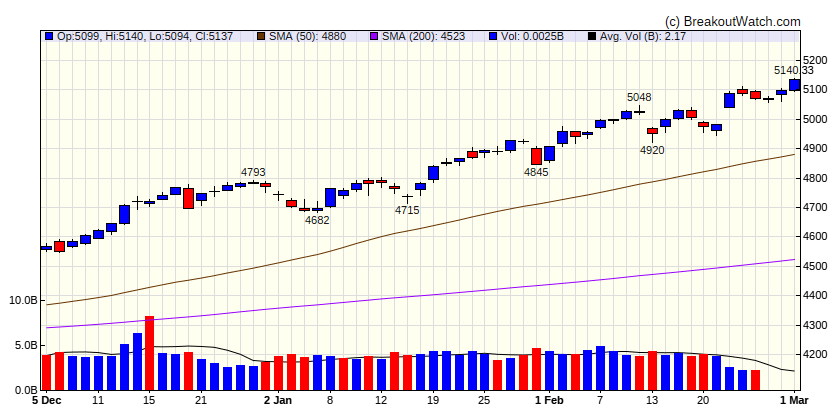
| S&P 500
|
| Last Close
| 5137 |
| Wk. Gain
| 0.86 % |
| Yr. Gain
| 8.26 % |
| Trend
| Up |
|
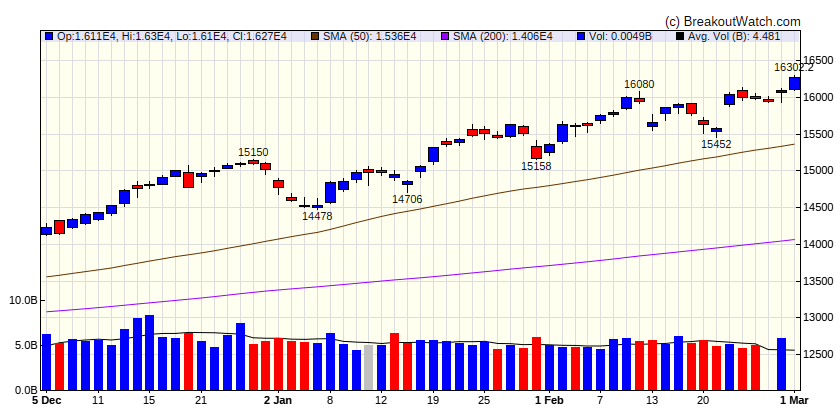
| NASDAQ Comp.
|
| Last Close
| 16275 |
| Wk. Gain
| 1.63 % |
| Yr. Gain
| 9.42 % |
| Trend
| Up |
|
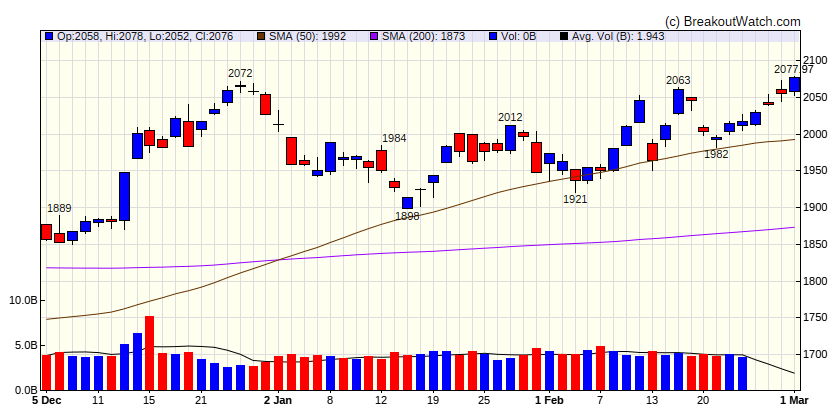
| Russell 2000
|
| Last Close
| 2076.39 |
| Wk. Gain
| 3.15 % |
| Yr. Gain
| 3.15 % |
| Trend
| Up |
|
Performance by Sector
| Sector |
Wk. Change % |
Yr. Change % |
Trend |
| Consumer Discretionary |
2.05 |
4.71 |
Up |
| Consumer Staples |
-0.11 |
4.17 |
Up |
| Energy |
1.54 |
3.15 |
Up |
| Finance |
0.42 |
6.71 |
Up |
| Health Care |
-0.59 |
7.53 |
Up |
| Industrials |
1.28 |
7.23 |
Up |
| Technology |
2.29 |
10.33 |
Up |
| Materials |
1.5 |
2.74 |
Up |
| REIT |
2.34 |
-1.68 |
Up |
| Telecom |
0.77 |
10.01 |
Up |
| Utilities |
0.22 |
-1.9 |
Up |
Breakouts This Week Still Within 5% of Breakout Price (Limit 20 top C Score)
| Watchlist |
Symbol |
Company |
Industry |
C Score* |
% Gain |
| *C score is our assessment of a Stock's correlation to CAN SLIM principles. It combines a stock's Technical and Fundamental merits and is expressed as a percentage. |
Breakdowns within 5% of Breakdown Price
| Watchlist |
Symbol |
Company |
Industry |
C Score* |
% Loss |
| SS |
TNK |
Teekay Tankers Ltd. |
Biotechnology |
72.2 % |
-0.1 % |
| SS |
OII |
Oceaneering International, Inc. |
Asset Management |
70.6 % |
-0.6 % |
| SS |
WST |
West Pharmaceutical Services, Inc. |
REIT - Retail |
65.5 % |
-1.1 % |
| SS |
VAL |
Valaris Limited |
Banks - Regional |
57.4 % |
-0.4 % |
| SS |
JILL |
J. Jill, Inc. |
Apparel Retail |
56.5 % |
-0.2 % |
| SS |
NICK |
Nicholas Financial, Inc. |
Credit Services |
50.7 % |
-2.2 % |
| SS |
MTEM |
Molecular Templates, Inc. |
Biotechnology |
42.5 % |
-2.6 % |
| SS |
FLUX |
Flux Power Holdings, Inc. |
Gambling |
38.1 % |
-4.8 % |
| *C score is our assessment of a Stock's correlation to CAN SLIM principles. It combines a stock's Technical and Fundamental merits and is expressed as a percentage. |
| There were no CWH stocks meeting our breakout model criteria |
| *C score is our assessment of a Stock's correlation to CAN SLIM principles. It combines a stock's Technical and Fundamental merits and is expressed as a percentage. |
Cup and Handle Chart of the Week
There were no cup and handle stocks meeting our breakout model criteria this week.