Breakoutwatch Weekly Summary 03/31/2024
You are receiving this email because you are or were a
BreakoutWatch.com subscriber, or have subscribed to our weekly
newsletter.
To read this newsletter on the site, click here: Newsletter
.
Market Summary
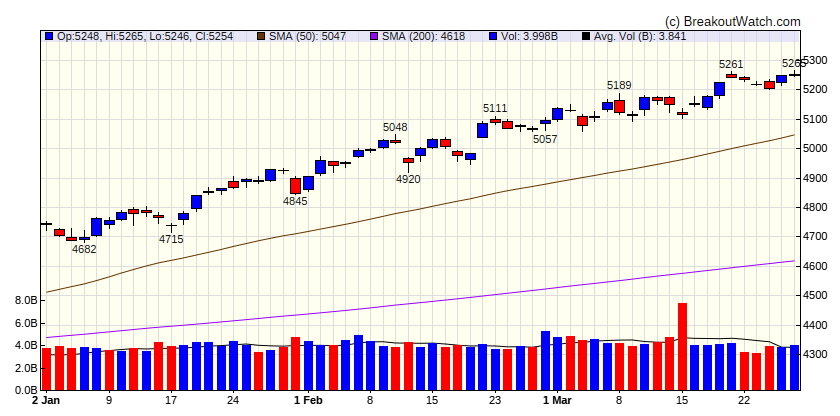
Stocks close out strong quarter with gains
Most of the major indexes advanced over the shortened trading week to end a quarter of strong gains. The S&P 500 Index recorded new closing and intraday highs to end the week. The market’s advance was notably broad, with an equal-weighted version of the S&P 500 Index gaining 1.64%, well ahead of the 0.39% increase in the more familiar market-weighted version. Small-caps also easily outperformed large-caps, and the Russell 1000 Value Index gained 1.79%, in contrast with the 0.60% decline in its growth counterpart. Markets were closed on Friday in observance of the Good Friday holiday but were scheduled to reopen on Monday in advance of many international markets. [more...]
Major Index Performance
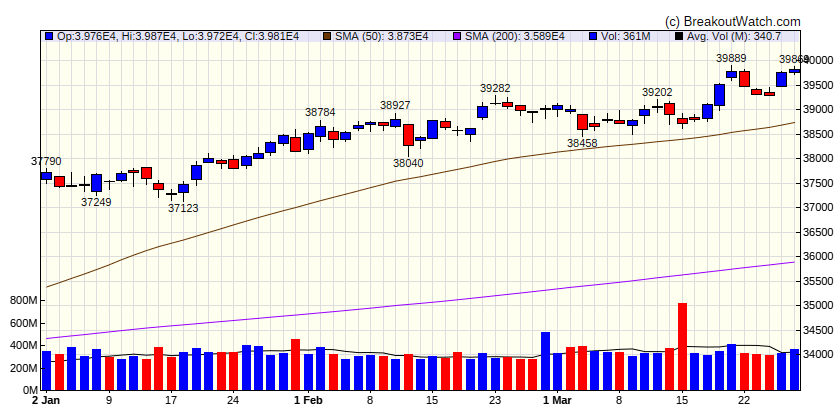
| Dow Jones
|
| Last Close
| 39807 |
| Wk. Gain
| 1 % |
| Yr. Gain
| 5.97 % |
| Trend
| Up |
|
| S&P 500
|
| Last Close
| 5254 |
| Wk. Gain
| 0.65 % |
| Yr. Gain
| 10.73 % |
| Trend
| Up |
|
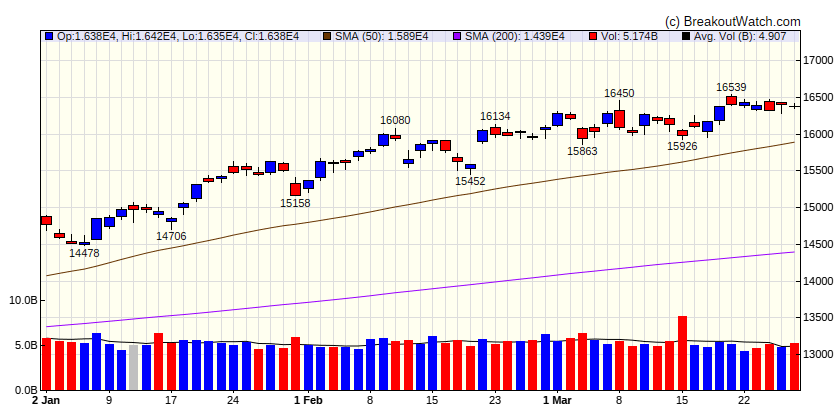
| NASDAQ Comp.
|
| Last Close
| 16379 |
| Wk. Gain
| 0.27 % |
| Yr. Gain
| 10.12 % |
| Trend
| Down |
|
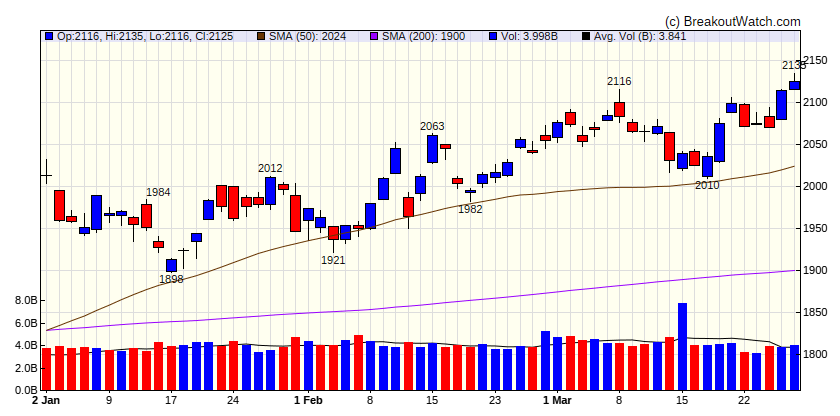
| Russell 2000
|
| Last Close
| 2125 |
| Wk. Gain
| 2.41 % |
| Yr. Gain
| 5.56 % |
| Trend
| Up |
|
Performance by Sector
| Sector |
Wk. Change % |
Yr. Change % |
Trend |
| Consumer Discretionary |
1.16 |
4.82 |
Up |
| Consumer Staples |
0.92 |
7.26 |
Up |
| Energy |
1.93 |
11.65 |
Up |
| Finance |
1.77 |
11.6 |
Up |
| Health Care |
1.5 |
8.34 |
Up |
| Industrials |
0.77 |
11.55 |
Up |
| Technology |
0.06 |
9.69 |
Up |
| Materials |
2.04 |
8.3 |
Up |
| REIT |
2.16 |
-1.78 |
Down |
| Telecom |
0.17 |
12.21 |
Up |
| Utilities |
2.59 |
4.57 |
Up |
Breakouts This Week Still Within 5% of Breakout Price (Limit 20 top C Score)
| Watchlist |
Symbol |
Company |
Industry |
C Score* |
% Gain |
| CWH |
BURL |
Burlington Stores, Inc. |
Apparel Retail |
82.7 % |
0.3 % |
| SQZ |
LOB |
Live Oak Bancshares, Inc. |
Banks - Regional |
78.9 % |
0.7 % |
| SQZ |
VIRC |
Virco Manufacturing Corporation |
Biotechnology |
77 % |
2.6 % |
| SQZ |
VTSI |
VirTra, Inc. |
REIT - Healthcare Facilities |
76.9 % |
1.7 % |
| SQZ |
MHO |
M/I Homes, Inc. |
Residential Construction |
76 % |
4.6 % |
| SQZ |
FRO |
Frontline Plc Ordinary Sh |
Banks - Regional |
75.3 % |
0.4 % |
| SQZ |
VVI |
Viad Corp |
Specialty Business Services |
74.8 % |
4.9 % |
| CWH |
TGT |
Target Corporation |
Discount Stores |
74.4 % |
1 % |
| SQZ |
FROG |
JFrog Ltd. |
Software - Application |
74.1 % |
0.7 % |
| SQZ |
GEOS |
Geospace Technologies Corporation |
Restaurants |
72.9 % |
1.1 % |
| SQZ |
RRR |
Red Rock Resorts, Inc. |
Restaurants |
71.9 % |
0.3 % |
| CWH |
FIS |
Fidelity National Information Services, Inc. |
Information Technology Services |
70.7 % |
2.5 % |
| SQZ |
STC |
Stewart Information Services Corporation |
Banks - Regional |
70.6 % |
3.6 % |
| CWH |
JELD |
JELD-WEN Holding, Inc. |
Capital Markets |
67.5 % |
1.6 % |
| SQZ |
RYTM |
Rhythm Pharmaceuticals, Inc. |
Biotechnology |
66.4 % |
3.7 % |
| SQZ |
MATX |
Matson, Inc. |
Marine Shipping |
64.6 % |
3.3 % |
| SQZ |
DBRG |
DigitalBridge Group, Inc. |
Real Estate Services |
64.4 % |
3.5 % |
| SQZ |
BZH |
Beazer Homes USA, Inc. |
Residential Construction |
62.5 % |
2.9 % |
| SQZ |
VNO |
Vornado Realty Trust |
REIT - Office |
61.5 % |
4.7 % |
| SQZ |
USM |
United States Cellular Corporation |
Telecom Services |
60.9 % |
1.4 % |
| *C score is our assessment of a Stock's correlation to CAN SLIM principles. It combines a stock's Technical and Fundamental merits and is expressed as a percentage. |
Breakdowns within 5% of Breakdown Price
| Watchlist |
Symbol |
Company |
Industry |
C Score* |
% Loss |
| SS |
HOLI |
Hollysys Automation Technologies, Ltd. |
Recreational Vehicles |
73 % |
-0 % |
| SS |
PARR |
Par Pacific Holdings, Inc. |
Entertainment |
69.1 % |
-0 % |
| SS |
PRDO |
Perdoceo Education Corporation |
Medical Devices |
65.4 % |
-0.3 % |
| SS |
PBYI |
Puma Biotechnology Inc |
Biotechnology |
61.7 % |
-3.1 % |
| SS |
MNTX |
Manitex International, Inc. |
Shell Companies |
59.8 % |
-3.9 % |
| SS |
ROIV |
Roivant Sciences Ltd. |
Biotechnology |
45.7 % |
-2.2 % |
| *C score is our assessment of a Stock's correlation to CAN SLIM principles. It combines a stock's Technical and Fundamental merits and is expressed as a percentage. |
| There were no CWH stocks meeting our breakout model criteria |
| *C score is our assessment of a Stock's correlation to CAN SLIM principles. It combines a stock's Technical and Fundamental merits and is expressed as a percentage. |
Cup and Handle Chart of the Week
There were no cup and handle stocks meeting our breakout model criteria this week.