Factors Contributing To Breakout Performance

Part 1: The breakout day volume

This week we start a series of articles on what determines a viable breakout from a cup-with-handle chart pattern. By a viable breakout we mean:
  1. More likely than not to provide the opportunity for a gain of at least 25%
  2. Low probability of failure (by which we mean low probability of being stopped out using an 8% stop loss).
  3. Likely to achieve the profit objective within six months.
We start today by looking at the most fundamental question: what constitutes a breakout?

The first requirement is that a breakout must exceed a target price. For our purposes, the target price is determined by the pivot point of the chart pattern that applies to the stock. We usually refer to it as the breakout price or BoP and for our analysis we are going to require that the BoP be $0.10 above the pivot.

The second requirement is that the stock must close the day above its BoP.

Thirdly, the daily volume must exceed the average volume by some factor. Since we began our site in 2003, we have assumed the necessary factor was 1.5 times the 50 day average volume. This factor comes from the work of William O'Neil who suggested it in "How to Make Money in Stocks". We have never examined that assumption and that's our focus in this article.

Methodology

To examine the relationship between volume and subsequent performance we examined our database of cup-with-handle stocks going back to January, 2004. For each stock on cup-with-handle watchlist, we selected those that closed above the breakout price (BoP) and noted their volume and 50 day average volume on that day. For the purposes of this discussion we will call that breakout day (BD).  We ignored whether or not we had classified it as a breakout on that date because that was an assumption that we were testing.

We then looked at the price in the six months following BD. If the intraday price fell by more than 8% from the BoP, then we counted that as the fail date. We then took the highest intraday price before either the fail date or the six-month end date.

Next, we calculated two variables:

advRatio = (Volume on BD)  / (50 day average volume at BD)
i.e. the ratio of BDday volume to adverage daily volume

maxGain = ((highest intraday high after BD) / (BoP at BD) - 1) x 100.
i.e. the profit if bought at the BoP and sold at the subsequent intraday high

While achieving the maximum gain in real life would be difficult, this allows us to examine the relationship between performance after breakout day and volume on breakout day.

We now had 4101 cases to examine which spanned two bull markets and one extreme bear market - a sizable sample over good and bad market conditions.

We then did a scatter plot of our observations.

scatter plot

Based on O'Neil's suggested threshold volume level for breakouts, we might expect that the biggest gains would occur at advRatios above 1.5 but there are clearly some whopping gains below that level. However there are also a majority of gains less than our target 25% below that level, so is the 1.5 level an adequate discriminator for our purposes, and if not what is?

Before moving on to answer those questions, observe that the mean of the maxGain is 17.4 but the median is just 10.6. That tells us that the data is heavily skewed and is confirmed by the skewness number. That means that the maxGain data is not normally distributed so standard statistical measures such as standard deviation are of little value. (There is also kurtosis in the data but we will ignore that here).

Now we divide our data into two groups using an advRatio of 1.5 as the discriminant. When we compare the means of the two groups we find:

adv 1.5 cutoff

This chart shows the mean maxGain for the two groups (circle) with the standard error. As noted above the standard error is not accurate but does show that the estimate of the mean of the two populations is more precise for the left group because there are more values in it.

Note that the mean of the right hand group falls below our target maxGain of 25% so we conclude that an advRatio 0f 1.5 is not, on its own, suitable for our purpose of defining a suitable breakout volume threshold.

To investigate further we divide advGain into subsets with break points every 0.25.

adv Categories

This chart again shows the mean maxGain for each category and we see that our mean does not exceed our 25% target until we reach the cut off at 2.26. This suggests that we should use 2.5 as our volume threshold. Dividing our observations into two groups using an advRatio of 2.25 gives us:

AdvRatio 2.5

This illustrates that using a threshold of 2.25 times adv as a threshold for determining a confirmed breakout would satisfy our goal of achieving a possible average return of above 25%.

Returning to our scatterplot and overlaying our new threshold shows:

results

Conclusion

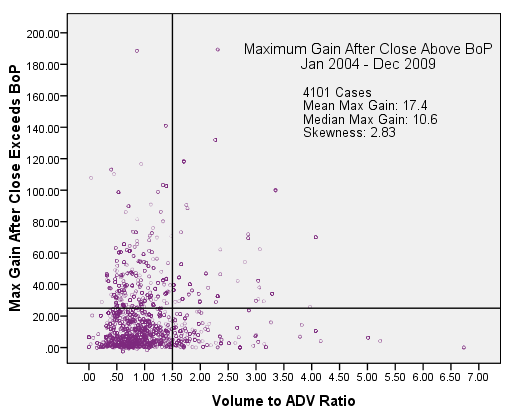
The maximum mean return from breakouts from a cup with handle base is 17.6% using an 8% stop-loss without considering breakout day volume as an additional criteria for selection. This  shows that breakouts  from a cup-with-handle base can be highly profitable.

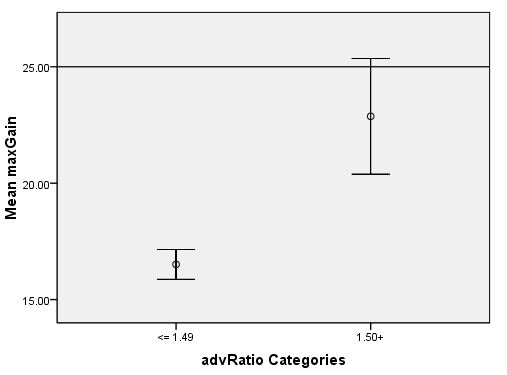
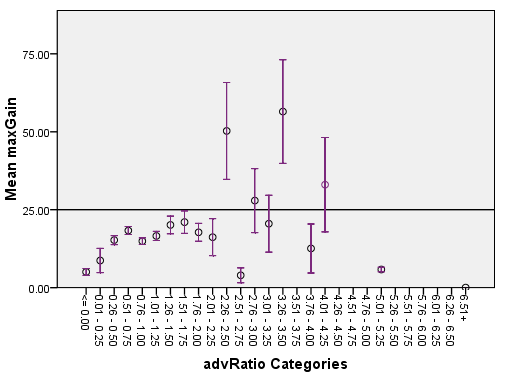
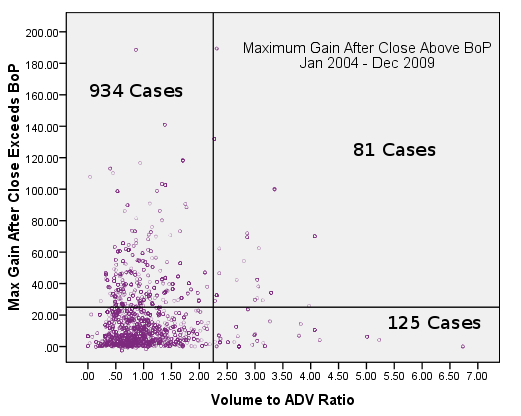
There is evidence that there is a relationship between breakout day volume and subsequent price performance. However, this relationship is a weak one and at least for cup-with-handle bases, a close above the breakout price on a volume threshold of 1.5 times average daily volume is not sufficient to conclude that the breakout can go on to make 
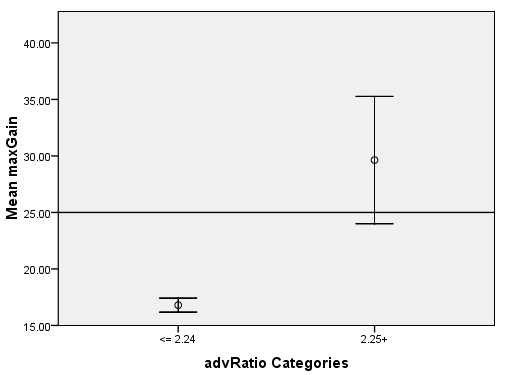
significant gains. A volume threshold of 2.25 times adv gives a mean return above 25% but even then the number of losing cases would significantly outweigh the number winning cases. Moreover, such a threshold, and the 1.5 times adv threshold also, would lead to a lot of highly profitable investment opportunities being missed.

Next time, we will look at other factors that can improve our return from cup-with-handle breakouts.