50 DMA Breakdown Watchlist Trading Hints
These suggestions are based on my analysis of results from the 50 dma breakdown watchlist, review of the literature and the experiences of a short sale hedge fund manager
- Short selling is risky because your potential loss is unlimited. When going long, the maximum amount you can lose is your initial investment, when shorting there is no limit to how high the stock can go from your entry level, so cover quickly when the stock moves against you.
- Review 50 dma breakdown watchlist prior to the market open to select stocks you would consider shorting if an alert is issued.
- Set a target cover price before you go short, using either a fixed percentage or an expected support level, and take profits at that level.
- If you go short on an alert and the stock recovers above the support level by the close, consider covering your position immediately.
- If you go short on an alert and the stock closes below the support price but volume doesn't meet the 1.5 times adv requirement, don't cover but wait for the action on the following day.
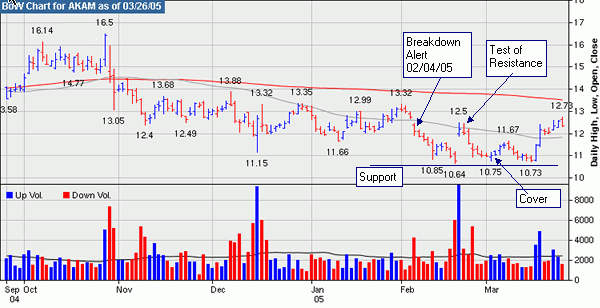
- After a confirmed breakdown a stock may recover to test the 50 dma resistance level - allow 2% overshoot before covering as the stock may breakdown again after testing resistance (see AKAM). If it holds at more than 2% above resistance, consider covering.
- Cover when a support level is tested and found to hold.
- Don't bet against the market.
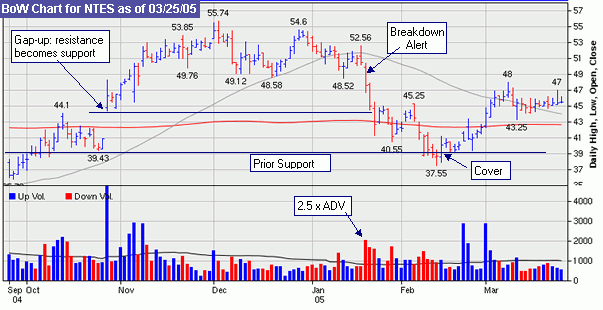
Here are some practical trading examples. On the day of breakdown, we issue an alert if the stock falls below support and the projected volume at the end of the day (based on a straight line projection) is at least 1.5 times average volume. So in the case of NTES, we would have issued an alert in the morning of Jan. 20 giving a potential short sale price of $49. The stock subsequently performed as follows:

The difficult decision when short selling is deciding when to cover. As a general guideline, look for support levels and cover when they hold. We see that there was an initial support level at about $44.50 which it crashed through and then reversed to re-test that support level as resistance 9 days later. It didn't hold above that level and then crashed through the 200 day moving average line. The next prior support level was at 39, so we would have waited to see if that support level held, or was breached. Although it dipped well below that level intra-day it did recover and that would have been the point at which we would have decided to cover for a gain of $10 (20.4%).
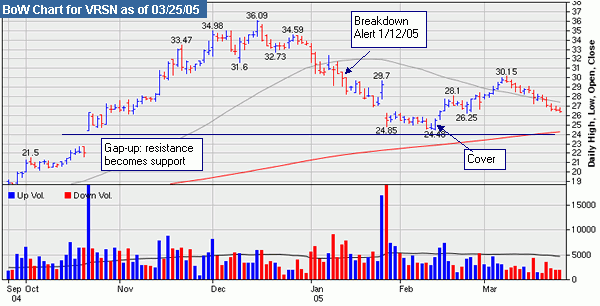
VRSN would have presented a similar situation, although in this case the short sale price following the alert would have been around $30 and the cover would have been at about $25 when it rebounded from the support level at 24.50 for a 16% gain.

The third stock on the list represents a different situation. In the case of AKAM, there was no clear prior support level. A breakdown alert would have been issued on 02/04 and a short sale would have been entered at around $12.30. After dropping to $10.64, it would have taken some courage not to cover on the gap-up on 2/18. However, it closed below the 50 dma resistance level and re-tested that level again the next day, but again closed below it. The previous low of $10.64 was now the support level and when it failed to reach that level and recovered from the $10.75 level it would have been wise to cover. That level was tested again 9 days later giving a second confirmation to cover at around $11.00. Net gain on the transaction 10.6%.

© breakoutwatch.com 2026. All Rights Reserved.