Cup and Handle Pattern Watchlist Methodology
Each day we search for stocks that are currently in a cup and handle pattern and place them on our cup and handle pattern watchlist. When they start to breakout, we alert you in real time so you can jump in at the optimum time.
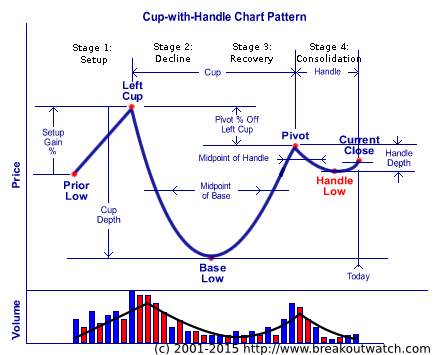
The cup and handle pattern is one of the most profitable breakout patterns. For an analysis of how and why it forms, see our tutorial Anatomy of a Cup-with-Handle Chart Pattern. To determine if the stock is in this pattern we examine the closing prices of the stock over the last 18 months and measure the key price points shown in this diagram.
Cup and Handle Pattern

To qualify as a cup-with-handle the key measurements must meet the following criteria:
| Data Point |
Definition |
Criteria |
|---|---|---|
| Current Close | Current closing price as of the date the watchlist is prepared. | >=$6 and >= 95% of 200 day moving average |
| Pivot | Highest intraday high that marks the beginning of the Handle. | Must be within last 90 days |
| Pivot % off Left Cup | Difference between the Left Cup and the Pivot, expressed as a percentage of the Left Cup. | <= +5% and >= -40% |
| Left Cup | Highest intraday high that marks the beginning of the correction. | >= 25 days and <=325 days from the pivot |
| Cup length to Handle length Ratio | The length of the cup relative to the length of the handle. | >= 3 |
| Prior Low | Lowest intraday low prior to the Left Cup. | Rise from Prior Low to Left Cup >=30% |
| Setup Gain % | The rise from the prior low to the left cup measured as a percentage of the prior low | >= 30% |
| Base Low | Lowest intraday low within the Cup. | None |
| Cup Depth | Difference between the Left Cup and Base Low, expressed as a percentage of the Left Cup. | <=60% |
| Handle Depth | Difference between the Pivot and the Handle Low, expressed as a percentage of the Pivot. | <= 30% |
| Midpoint of Base | Price which marks half the distance between the Left Cup and the Base Low. | None |
| Midpoint of Handle | Price which marks half the distance between the Pivot and the Handle Low. | >= Midpoint of Base |
| The stock must also meet these technical criteria to improve the chances of a successful breakout: | ||
| Current Close | The price at which the stock closed today. | >= $6 |
| Average Volume | The average daily volume over the last 50 days | >=30,000 |
Relative Strength (RS)Rank |
The stock’s weighted price appreciation over the prior year, as ranked against all other stocks in our database. | >=80 |