Over the vacation I have been examining ways to improve the strategy suggestions for trading stocks on the Cup and Handle watchlist. I was motivated to do this because the published suggestions, which had worked well in 2016, did not function so well in 2017 and so changes were clearly necessary. I approached this by first looking at the factors that influenced whether or not a stock on the watchlist would exceed its breakout price on the next day and then proceeded to find the optimum configuration of these factors that would give the highest probability of predicting a close above breakout price. This process gave me a new metric that predicted a close above BoP with 73% accuracy in 2017 and 66% when back tested to 2014. It also led me to new strategy suggestions for Buy on Alert and Buy at next Open.
I have a database of all alerts that were issued since 2014. I extracted from this all the alerts that were issued for stocks on the Cup and Handle Watchlist and then categorized them into two groups: those that closed above their BoP and those that did not. In addition to knowing the alerts that were issued, I maintain a historical database of all stocks on NYSE, NASDAQ and AmEx exchanges and their associated daily metrics. Prices in this database are adjusted for corporate actions (splits, dividends) and the original alert and BoP's were adjusted as necessary for consistency. Using a statistical technique called Discriminant Analysis I was able to identify the factors on the day before the alert was issued that had a statistically significant influence on the final close on the day an alert was issued. These factors, in order of importance were:
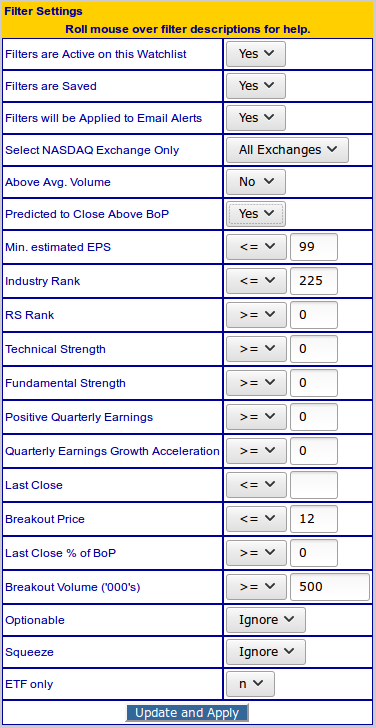
I further found that this model was most effective for stocks with an average daily volume of at least 500,000 and were in the BoP range $6 - $12. The model is only applied to stocks meeting these criteria.
The following table shows how the model allocated stocks to each group compared to the group to which the stocks belonged. It shows that of 137 alerts in 2017 that satisfied the price and volume preconditions, 100 were allocated correctly (38 to the non-breakout group and 62 to the successful breakout group). That's a success rate of 73%.

When the model was applied to all alerts back to 2014 (including 2017) the success rate fell to 66%. Of 788 stocks that met the price and volume preconditions, 523 were allocated correctly.

Based on this model, we can identify that if an alert is given (meaning the real-time price has reached the BoP) on a stock that the model predicts will close above BoP, then the stock will close above BoP with an approximately 70% probability
If those conditions are met, then by using the backtest tool, I have determined the optimum return trading rules:
Buy if:
Sell if
Applying these rules to alerts in 2017, and fully reinvesting gains, the backtest tool gave a 71% return.

Stocks that are predicted to close above their BoP at the next session can be found by using these settings on the Cup and Handle watchlist.
