| Market Summary | Weekly Breakout Report | Top Breakout Choices | Top 2nd Chances | New Features | Tip of the Week |
Although trading was light during this holiday week, we saw the NASDAQ and S&P 500 continue their upward trend, while the DJI pulled back slightly. All indexes were up for the year for the second year in succession, although it is only recently that we saw the indexes surpass their highs set in late January, so for most of the year the markets were struggling to make headway. The S&P 500 performed best of the major indexes, gaining 9.3% for the year, followed by the NASDAQ, which gained 8.4%. We expect the upward trend to continue as volume picks up in the New Year.
The light volume this week meant that it was difficult for stocks to meet our breakout criterion requiring 150% of average daily volume to qualify as a breakout. As a result, fewer alerts were issued than usual, and fewer breakout attempts were successful. Those that did break out, however, did so with gusto and some impressive gains were to be had: EZPW broke out on Tuesday to register a gain of 17.2% above its pivot at Friday's close; JUPM also broke out on Tuesday to make an intraday gain of 15.5% before closing on Friday for a still substantial 12.33% gain. Overall, breakouts finished the week 5.3% higher, easily beating the overall gain of the NASDAQ.
Transportation-Air Freight made a significant move up the industry rankings jumping 60 places. This may be a result of the crisis in SE Asia and/or because of record on-line holiday sales. Our 'Top Tip' this week looks at how to use industry analysis to fine tune your ability to select breakout candidates.
We are deeply moved by the crisis in SE Asia. Residing as we do in Hawaii, surrounded by strong earthquake zones (Japan, Alaska, and the fault lines of the western coasts of North and South America) we are consciously aware of the risk of tsunami's and the devastation they can bring, but we were in awe at the power the ocean unleashed last weekend. Consequently, breakoutwatch.com made a substantial contribution to the Red Cross and CARE to help the victims.
We would like to take to thank all of you who supported us during 2004, which allowed us to add many new features to the site. We will continue to add value to the site and have many exciting enhancements planned for the coming year. We wish you the very best success in your investment and other endeavors during 2005.
| Index | Value | Change Week | Change YTD | Market1 Signal |
||||||||||||||||||||||||||||||||
|---|---|---|---|---|---|---|---|---|---|---|---|---|---|---|---|---|---|---|---|---|---|---|---|---|---|---|---|---|---|---|---|---|---|---|---|---|
| Dow | 10783 | -0.41% | 3.59% | enter | ||||||||||||||||||||||||||||||||
| NASDAQ | 2175.44 | 0.69% | 8.41% | enter | ||||||||||||||||||||||||||||||||
| S&P 500 | 1211.92 | 0.15% | 9.33% | enter | ||||||||||||||||||||||||||||||||
1The Market Signal is derived from our proprietary
market model. The market model is described on the site. |
||||||||||||||||||||||||||||||||||||
# of Breakouts
|
Period Average1
|
Max. Gain During Period2
|
Gain at Period Close3
|
|
|---|---|---|---|---|
| This Week | 13 | 33.31 | 8.25% | 5.34% |
| Last Week | 17 | 39.08 | 7.32% | 3.81% |
| 13 Weeks | 434 | N/A | 17.85% |
11.33% |
Sector
|
Industry
|
Breakout Count for Week
|
|---|---|---|
Computer
|
Computer-Services
|
1
|
Computer
|
Computer-Integrated Sys
|
1
|
Energy
|
Energy-Other Sources
|
1
|
Healthcare
|
Healthcare-Med/Dent Services
|
1
|
Healthcare
|
Healthcare-Instruments
|
1
|
Healthcare
|
Healthcare-Nursing Homes
|
1
|
Internet
|
Internet-ISP/Content
|
1
|
Leisure
|
Leisure-Products
|
1
|
Leisure
|
Leisure-Gaming
|
1
|
Oil & Gas
|
Oil & Gas-Refining/Mktg
|
1
|
Real Estate/ REIT
|
Real Estate-REIT
|
1
|
Retail
|
Retail-Misc/Diversified
|
1
|
Telecomm
|
Telecomm-Wireless Services
|
1
|
2This represents the return if each stock were bought at its breakout price and sold at its intraday high.
3This represents the return if each stock were bought at its breakout price and sold at the most recent close.
Category |
Symbol |
Company Name |
Expected Gain1 |
|---|---|---|---|
| Best Overall | HAUP | Hauppauge Digital, Inc. | 116 |
| Top Technical | CVTX | CV Therapeutics, Inc. | 49 |
| Top Fundamental | AVID | Avid Technology, Inc. | 34 |
| Top Tech. & Fund. | SMTS | Somanetics Corporation | 51 |
Category |
Symbol |
Company Name |
Expected Gain1 |
|---|---|---|---|
| Best Overall | BRLI | Bio-Reference Laboratories, Inc. | 90 |
| Top Technical | ALDA | Aldila, Inc. | 65 |
| Top Fundamental | SNIC | Sonic Solutions | 64 |
| Top Tech. & Fund. | SNIC | Sonic Solutions | 64 |
There
were no new features added this week.
|
Using Industry Analysis to Fine Tune Candidate Selection
Our site is designed to allow you to quickly focus on stocks that offer suitable entry points. We focus on the cup-with-handle, double-bottom and flat-base patterns, because these are the patterns that offer the best opportunity for gains once the stock has broken out. But most of us have limited resources and can't invest in every breakout, so we need a methodology that allows us to narrow our selection of breakout candidates. This week we focus on such a methodology based around industry analysis and how breakoutwatch.com provides the tools to implement it.
The methodology essentially comprises three steps:
- Is the market trend favorable to taking long positions in stocks? If not, it is better not to risk one's capital purchasing breakouts, because you will be swimming against the tide. Some breakouts will be successful, but overall, the odds will be against you.
- Which industry groups are performing best? A breakout of a stock in a leading industry group will generally out perform a breakout in a laggard industry group
- Of the stocks in the chosen industry groups, which offer the best potential for gains?
Is the market trend favorable?
Our market signals provide a guide as to the overall favorability of the market. Firstly, the signal's 'enter' or 'exit' status provides a guide as to whether one should be invested in long positions at all. If the signal is 'exit' then you should be either in cash or taking shorting positions only. Secondly, The strength, or weakness, of our 'M' value, will tell you strength of the market's overall accumulation or distribution status.
Which Industry Groups are Performing Best?
Our Industry Analysis ranks 192 industries based on their overall technical strength. Note that this is different from IBD's methodology which combines a proprietary measure of technical and fundamental strength to achieve a relative ranking. Our Industry Ranking methodology is based on technical strength alone, because we believe the technical characteristics of an industry tells you how the market values the industry today, whereas the fundament characteristics tell you how the stock has performed historically.
Which stocks offer the best potential for gains?
We have analyzed breakouts since April, 2003 and built an 'Expected Gain' model that estimates the medium term potential gain of any individual stock that breaks out. We think this is your best guide to the potential gain of a candidate breakout. However, those of you guided by WON and Weinstein will want to look for the top stocks in the top industries. We will now show you how to find them using a combination of filters on our cup-with-handle watchlist for Friday, December 31, 2004. The technique is equally valid for the flat base and double bottom lists.
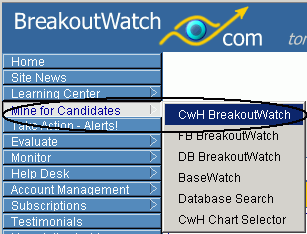
- Choose Mine for Candidates > CwH Breakoutwatch
- Click the 'Industry Indicators' tab to open the Industry Indicators part
of the CwH display.

- Set a filter to include only the top quartile of industries.
Since there are
192
industries,
this
will
be
the
top 48 industries. (This is just an example, you may wish to use a broader
or narrower selection criterion). Next, click the 'Apply' button to retrieve
the display filtered only to include industries ranked according to your
criterion. Filters aren't available to Silver or Gold members, but they can
sort the display
by Industry
Rank
and
then
focus
only
on the top ranked industries.

- Sort the display by Industry Rank by clicking on the 'Industry Rank' column
heading. The resulting display for 12/31/04 looks like this.
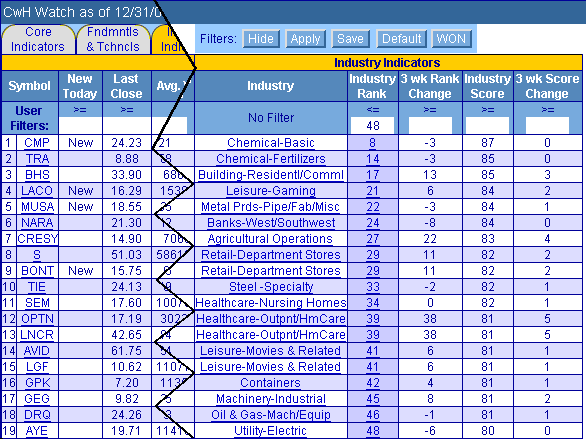
- Look down the list of stocks. Check the '3 wk Rank Change' column: if this
is negative then the industry may be in relative decline. If its positive,
then the industry is moving
up in the
relative rankings. You will probably want to focus on the higher ranked industries
that have made positive rank changes. You will also note that there are
'Industry Score' and '3 wk Score Change' columns. These indicate the technical
strength of the industry in 'absolute' terms. Note that it is possible to
have a negative rank change with a positive score change. This indicates
that the technical condition of the stock is improving, but not as rapidly
as the technical condition of other stocks, causing it to slip in the rankings.
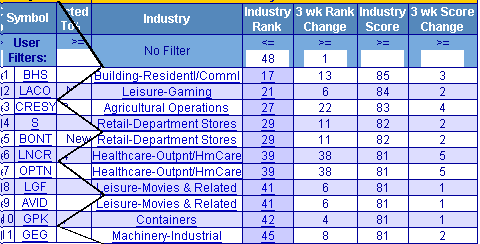
- Now we will add another filter for industries that have made a positive
change in rank. (We could have done this in step 3 and set a combined filter,
but we wanted to make the point about positive vs negative rank and score
changes.) Applying the filter we now get the following list:
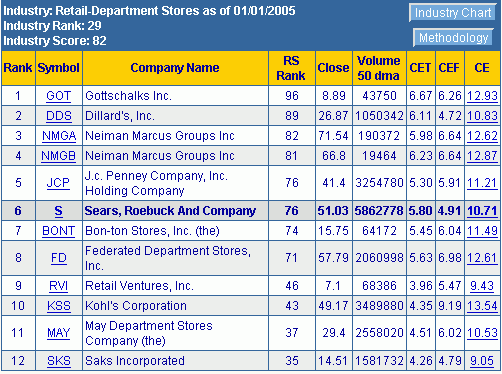
- Click on the Industry name for your chosen stocks - this will bring
up a list of all stocks in the industry ranked by descending RS. You will
probably want to focus on those stocks that are among the leaders in their
industry group. Since this is prime retail season, we will choose the industry
for S (Sears, Roebuck). Clicking on Retail Department Stores on the line
for S we get a list of stocks in that industry group ranked by relative strength
(RS) with our selected stock highlighted to show its position in the group.
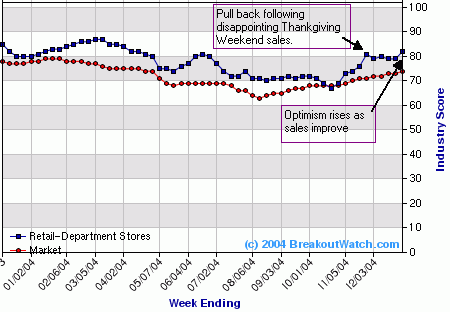
- Finally, we can review the chart for the industry by clicking the Industry
Chart button on the list above. This will bring up a chart of industry rank
and score over the last year. The industry score chart also shows the score
relative to the market's overall technical condition. We see that Retail
has generally out performed the market over the last year, and has improved
its position relative to the market over the last week.
After completing these 8 steps you will have a list of leading stocks in leading industries that are still improving their relative position and are ready to breakout. Your total time? Just a few minutes at most. How long would it take using IBD or investors.com to compile a similar list?
Remember that you can add other filter criteria in addition to your Industry Rank filter and then save your filters so they will be available to you next time you open up the watchlist. You can also ensure you only receive email alerts on stocks that pass your filter criteria by checking 'Send email alerts only on stocks that match my stored filters' on the Account Management > Update Account menu choice.
Please review our newsletter archive and learning Center Tutorials for previous articles in this series. We invite your questions or comments on these articles in our Tutorials forum.
If you received this newletter from a friend and you would like to receive it regularly please go to the BreakoutWatch.com site and enter as a Guest. You will then be able to register to receive the newsletter.
Copyright © 2005 NBIcharts, LLC dba BreakoutWatch.com. All rights reserved.