| Market Summary | Weekly Breakout Report | Top Breakout Choices | Top 2nd Chances | New Features | Tip of the Week |
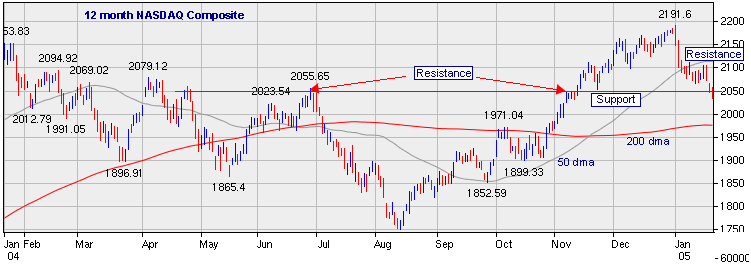
After opening the week on Tuesday with a positive move, the markets then traded downwards for the rest of the week to close down 2.6% on the NASDAQ, 1.6% on the DJI and 1.4% on the broader S&P 500 index. Last week we looked at the week's trading action and found reasons for cautious optimism but there were no redeeming features this week. The NASDAQ rose to near its 50 day moving average where it met resistance and retreated. The markets closed on Friday at or very near their lows for the week and are now at levels not seen since around November 10. In other words, nearly all the gains from the post-election rally have been erased.
After retreating from resistance at the 50 dma level, the NASDAQ found support briefly around the 2050 level on Thursday night and Friday morning. This level had shown some significance over the last 12 months as initially a line of resistance when the index tried to rally and then as a support level. The index fell through that rather thin ice late in the day on Friday and that level must now be seen as a resistance level if a new rally begins. That doesn't seem likely, however and there doesn't appear to be any strong support until the 200 dma level.
Our market model has not yet signaled an exit for the DJI or S&P 500, but Friday was the 6th distribution day in 13 sessions for the S&P 500 and another one on Monday will generate an exit signal. The distribution day count for the DJI is at 4 in 10 sessions, whereas 7 in 12 sessions is needed to generate an exit signal, so distribution days on Monday and Tuesday for that index could generate an exit signal also. But before we get too pessimistic we should remember that the markets have a way of proving us wrong, and just when things look at their worst (or best!) they have a habit of reversing, so perhaps the main reason for optimism this week is that there doesn't seem to be any reason for optimism. In these circumstances, it is appropriate to be searching for the new leaders that will emerge to lead the market higher.
Inevitably there were fewer successful breakouts this week and gains were less although they still outperformed the markets. Cablevision (CVC) made big moves from the bottom of its handle on Wednesday and then again Thursday when it closed just below its pivot point on massive volume. This was a harbinger of a gap-up on Friday when it opened 8% above its pivot and went on to close at 12.1% above its breakout price. This is an example of when the usual prohibition on buying at more than 5% above the pivot can be ignored. A gap up is a very bullish sign, but buying breakouts in this market is taking on more risk than most people like to bear.
After our normal daily update on Monday, we are releasing a significantly enhanced Industry Analysis feature. You can see a preview in our tip of the week section at the end of this newsletter.
| Index | Value | Change Week | Change YTD | Market1 Signal |
||||||||||||||||||||||||||||||||
|---|---|---|---|---|---|---|---|---|---|---|---|---|---|---|---|---|---|---|---|---|---|---|---|---|---|---|---|---|---|---|---|---|---|---|---|---|
| Dow | 10393 | -1.56% | -3.62% | enter | ||||||||||||||||||||||||||||||||
| NASDAQ | 2034.27 | -2.57% | -6.49% | exit | ||||||||||||||||||||||||||||||||
| S&P 500 | 1167.82 | -1.41% | -3.64% | enter | ||||||||||||||||||||||||||||||||
1The Market Signal is derived from our proprietary
market model. The market model is described on the site. |
||||||||||||||||||||||||||||||||||||
# of Breakouts
|
Period Average1
|
Max. Gain During Period2
|
Gain at Period Close3
|
|
|---|---|---|---|---|
| This Week | 14 | 27.54 | 3.5% | 1.57% |
| Last Week | 17 | 29.38 | 6.34% | -0.24% |
| 13 Weeks | 362 | N/A | 17.18% |
3.52% |
Sector
|
Industry
|
Breakout Count for Week
|
|---|---|---|
Finance
|
Finance-Savings&Loan
|
2
|
Computer Software
|
Comp Software-Enterprise
|
1
|
Electronics
|
Electr-Semicndtr Mfg
|
1
|
Healthcare
|
Healthcare-Biomed/Genetic
|
1
|
Healthcare
|
Healthcare-Products
|
1
|
Insurance
|
Insurance-Diversified
|
1
|
Media
|
Media-Cable/Satellite TV
|
1
|
Mining
|
Mining-Misc Ores
|
1
|
Oil & Gas
|
Oil & Gas-Refining/Mktg
|
1
|
Real Estate/ REIT
|
Real Estate Management
|
1
|
Special
|
Special-Market/Tracking Funds
|
1
|
Special
|
Special-ClsdEndFunds/Bond
|
1
|
2This represents the return if each stock were bought at its breakout price and sold at its intraday high.
3This represents the return if each stock were bought at its breakout price and sold at the most recent close.
Category |
Symbol |
Company Name |
Expected Gain1 |
|---|---|---|---|
| Best Overall | RBAK | Redback Networks Inc. | 84 |
| Top Technical | BLT | Blount International, Inc. | 5 |
| Top Fundamental | CCBI | Commercial Capital Bancorp, Inc. | 10 |
| Top Tech. & Fund. | CCBI | Commercial Capital Bancorp, Inc. | 10 |
Category |
Symbol |
Company Name |
Expected Gain1 |
|---|---|---|---|
| Best Overall | MAPS | MapInfo Corporation | 31 |
| Top Technical | IMDC | Inamed Corporation | 23 |
| Top Fundamental | MAPS | MapInfo Corporation | 31 |
| Top Tech. & Fund. | IMDC | Inamed Corporation | 23 |
There were no new features added this week.
We did migrate the site to a new, more powerful server, and response times have improved markedly. Next week we will release a greatly enhanced Industry Analysis server.
Getting the Most out of Industry Analysis
Our Industry Analysis service has disappointed some subscribers who are familiar with, and rely on, the industry rankings published by Investor's Business Daily (IBD). We think we have sound reasons for ranking industries based on technical strength in the way we do (which are described on our Industry Methodology page), but we also want to serve as broad a group of subscribers as possible, so we are significantly enhancing this area of our service to provide powerful new analytical features at no extra charge to subscribers.
The new Industry Analysis screen will allow ranking of industries by each of four different criteria: Technical strength, Fundamental strength, Combined Technical and Fundamental strength (as measured by our CANTATA Evaluator (CE) metric), and by Price strength. This new service will be available after the daily update on Monday, January 24.
The Price strength ranking method is very similar to that used by IBD and produces comparable, although not exactly similar, results. It looks at weighted ratios of average price movements over the last 3 and 6 month periods to develop a 'score' for each industry which is then used to rank the industries from 1 to 192. While the resulting rankings are similar to IBD's, they are not identical for several reasons:
- IBD's industry groupings are proprietary so we cannot reproduce them.
- IBD's database of stocks is not identical to our own
- IBD's price ranking formula is a proprietary 'black box' not open to evaluation, while ours is not and will be published on the methodolgy page when we release the new service.
The new service is provided through a simple, but powerful display.
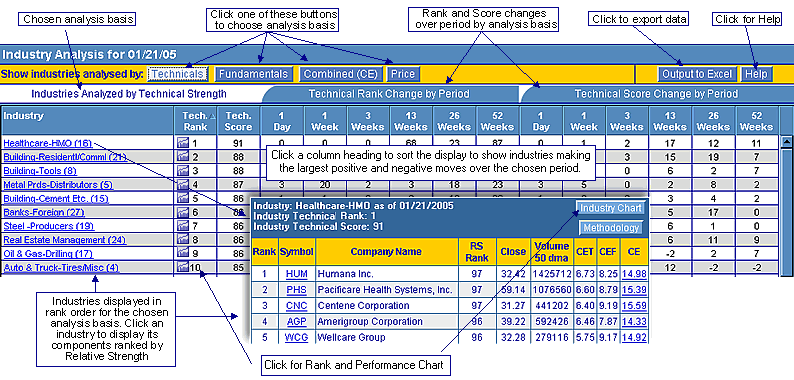
Here's some examples of how to use this:
- Click the 'Price' button to display rankings by the same criteria as IBD
- Click the '1 Day' column heading to see industries making the biggest negative moves (sort in ascending order)
- Click the '1 Day' column again to see industries making the biggest positive moves (sort in descending order)
Perhaps of most value is that these industry rankings are updated daily, not weekly.
For subscribers who are looking for the leading stocks in the leading industry groups (or the inverse!) measured on technical, fundamental, combined or purely price performance grounds, we think this service offers unparalled value in versatility, power and useability.
If you received this newletter from a friend and you would like to receive it regularly please go to the BreakoutWatch.com site and enter as a Guest. You will then be able to register to receive the newsletter.
Copyright © 2005 NBIcharts, LLC dba BreakoutWatch.com. All rights reserved.