| Market Summary | Weekly Breakout Report | Top Breakout Choices | Top 2nd Chances | New Features | Tip of the Week |
The markets closed the week higher than they had begun it, but only just. The Dow was the winner with a gain of just 0.33%, with the S&P 500 in close second place followed by the NASDAQ with a gain of just 0.08%. We generally leave it to other commentators to try to explain the economic, political and psychological reasons for the market's decline, so we will not speculate about how we got here or where those factors might lead us, but instead confine ourselves to reading the future in the tea-leaves from a technical perspective.
We are presently at the fourth day of a mini-rally that began on Tuesday. We now look for a follow-through day in the next 9 sessions to confirm that the rally has some strength. While we hope for that outcome, there are other possibilities also which we will now examine. The chart below shows the NASDAQ composite over the last 10 months with 3 support lines labeled A, B and C. Firstly, let me note that support/resistance lines indicate an area of support and will rarely be absolutely respected. There will usually be some mild overshoot in either direction.
Support Line A shows a level of support around the 1900 level, and remembering also that once crossed, support becomes resistance, we see that this line was significant over the last 10 months. Support Line B shows the support levels that persisted since the rally began in August. Since the index has fallen through that support line, it now becomes resistance if the index continues to advance. Note that the line intersects the 50 dma as it turns down at the right of the chart, which is also resistance becuse the index must penetrate it to rise. Support line C shows the support levels so far this year. Note that this is on track to intersect with the 200 day moving average line and then the Support line A. We also show the most recent line of resistance, labeled D, descending from the December 31 high. Based on this analysis we can see three scenarios developing:
- The current mini-rally will stall when it meets the most recent line of resistance D. It will then fall to the 200 dma line, where if it does not find support, it will fall to the intersection of lines C and A in the neighborhood of 1900.
- The current mini-rally will break through D and stall when it meets the 50 dma and former support line B, it will then fall to D which will then become support.
- The current mini-rally is the start of a powerful new rally that will power through resistance line D and the 50 dma. (Lapsing into punditry for a moment, I think some very positive political and/or economic news will be necessary for this to happen. Look for a bounce if the Iraq elections are not a total disaster).
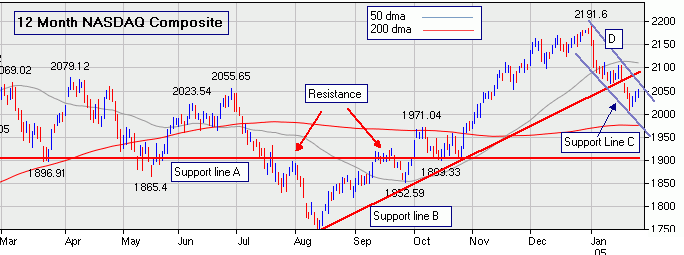
We don't know what the outcome will be, we only know that there are lots of technicians and computer algorithms looking at the same data who are likely to draw similar conclusions. Which way they place their bets will determine the outcome.
The number of successful breakouts more than doubled this week to 31. It is interesting, but not really surprising, that the number of successful breakouts increases as market conditions improve, confirming that the market is such an important factor. A glance at the Breakout Report on the site for the week shows several stocks making double digit gains, such as CTEC (24%), BEV (25%), AFFX (11.25%) and TIE (10.4% on Friday alone) which broke out for the second time this month for an overall gain of 18%. Although January was a very disappointing month overall, many stocks from our watchlists did very well indeed: such as GLBC (32%) and SYNM (37%).
The most active sector producing breakouts this week was Healthcare with 7 accounting for nearly 25% of all breakouts for the week.
Our Top Tip this week provides an update on our new Industry Analysis feature which was put into beta test on Monday.
Finally, I had some complaints that last week's newsletter was too wide to be printed in portrait mode. This will sometimes happen if the charts I use are too wide. I'll try to keep them narrow enough to fit on a page, but sometimes that will not be possible, and in that case you can try increasing your print margins or printing in landscape mode. Doing a print preview before printing should show you what you need to do.
[Late breaking news: we had some technical difficulties Friday evening and the site was either not functioning normally, or not avaiable on Saturday. That has been fixed and accounts for the lateness of this newsletter].
| Index | Value | Change Week | Change YTD | Market1 Signal |
||||||||||||||||||||||||||||||||
|---|---|---|---|---|---|---|---|---|---|---|---|---|---|---|---|---|---|---|---|---|---|---|---|---|---|---|---|---|---|---|---|---|---|---|---|---|
| Dow | 10427.2 | 0.33% | -3.3% | enter | ||||||||||||||||||||||||||||||||
| NASDAQ | 2035.83 | 0.08% | -6.42% | exit | ||||||||||||||||||||||||||||||||
| S&P 500 | 1171.36 | 0.3% | -3.35% | enter | ||||||||||||||||||||||||||||||||
1The Market Signal is derived from our proprietary
market model. The market model is described on the site. |
||||||||||||||||||||||||||||||||||||
# of Breakouts
|
Period Average1
|
Max. Gain During Period2
|
Gain at Period Close3
|
|
|---|---|---|---|---|
| This Week | 31 | 25.77 | 6.35% | 4.4% |
| Last Week | 14 | 27.54 | 4.8% | 1.06% |
| 13 Weeks | 338 | N/A | 16.1% |
3.34% |
Sector
|
Industry
|
Breakout Count for Week
|
|---|---|---|
Healthcare
|
Healthcare-Biomed/Genetic
|
3
|
Healthcare
|
Healthcare-Products
|
3
|
Retail
|
Retail-Restaurant
|
2
|
Special
|
Special-ClsdEndFunds/Bond
|
2
|
Transportation
|
Transportation-Ship
|
2
|
Banks
|
Banks-Foreign
|
1
|
Beverages
|
Beverages-Soft Drink
|
1
|
Chemical
|
Chemical-Specialty
|
1
|
Computer
|
Computer-Services
|
1
|
Computer Software
|
Comp Software-Financial
|
1
|
Computer Software
|
Comp Software-Enterprise
|
1
|
Energy
|
Energy-Other Sources
|
1
|
Food
|
Food-Sugar/Flour/Grain
|
1
|
Food
|
Food-Prepared
|
1
|
Healthcare
|
Healthcare-Nursing Homes
|
1
|
Oil & Gas
|
Oil & Gas-U S Explr/Prod
|
1
|
Oil & Gas
|
Oil & Gas-Refining/Mktg
|
1
|
Personal
|
Personal -Cosmetics
|
1
|
Real Estate/ REIT
|
Real Estate Development
|
1
|
Retail
|
Retail-Misc/Diversified
|
1
|
Special
|
Special-ClsdEndFunds/Intl
|
1
|
Steel
|
Steel -Specialty
|
1
|
Telecomm
|
Telecomm-Wireless Services
|
1
|
2This represents the return if each stock were bought at its breakout price and sold at its intraday high.
3This represents the return if each stock were bought at its breakout price and sold at the most recent close.
Category |
Symbol |
Company Name |
Expected Gain1 |
|---|---|---|---|
| Best Overall | RBAK | Redback Networks Inc. | 75 |
| Top Technical | BLT | Blount International, Inc. | 7 |
| Top Fundamental | AVID | Avid Technology, Inc. | 4 |
| Top Tech. & Fund. | AVID | Avid Technology, Inc. | 4 |
Category |
Symbol |
Company Name |
Expected Gain1 |
|---|---|---|---|
| Best Overall | CTIC | Cell Therapeutics, Inc. | 57 |
| Top Technical | GPRO | Gen-Probe Incorporated | 0 |
| Top Fundamental | GPRO | Gen-Probe Incorporated | 0 |
| Top Tech. & Fund. | GPRO | Gen-Probe Incorporated | 0 |
The new Industry Analysis service was released in beta test status. See below.
Our charts were enhanced to allow a small margin between the data and the vertical axis making the most recent data more easily readable.
New Industry Analysis service update
Our new daily industry analysis service went into operation on Monday. It was given beta test status and the daily updates are available to all subscribers. Once officially released, Silver subscribers will see the weekly, not daily update, which is the same level of concurrency that existed before the new service. Silver subscribers will benefit from the additional bases for analysis that were introduced. Due to the bugs and usability issues identified this week, the beta test is extended until further notice.
Several subscribers who do not have the Microsoft java virtual machine experienced problems with the buttons that select the basis for analysis and a fix for that was uploaded on Thursday night. An adjustment to the display width was also made so that it will fit on displays running at 1024 x 80 resolution.
A bug was found in the analysis by price module which will be corrected this weekend.
If you received this newletter from a friend and you would like to receive it regularly please go to the BreakoutWatch.com site and enter as a Guest. You will then be able to register to receive the newsletter.
Copyright © 2005 NBIcharts, LLC dba BreakoutWatch.com. All rights reserved.