| Market Summary | Weekly Breakout Report | Top Breakout Choices | Top 2nd Chances | New Features | Tip of the Week |
The downward trend I discussed last week continued and the markets again closed the week lower with the DJI losing 1.8%, the S&P 500 1.5% and the NASDAQ just 0.8%. Now there's a change - the NASDAQ was the best performing index for the week! For the reason the NASDAQ fared less badly, consider that the price of oil continues to be a concern and the markets focused on inflation following the Federal Reserve's warning that inflation pressures are mounting. The stocks most likely to be affected by inflation are the large caps that comprise the DJI and the S&P 500 as their borrowing and wage costs escalate and so these were the stocks hit hardest.
The DJI came close to causing our market model to issue an exit signal. As of Wednesday, the DJI had suffered 6 distribution days in 11 sessions. The trigger for an exit signal is 7 distribution days in 12 sessions, so the index just dodged the bullet on Thursday when the index closed lower but on volume that was less than Wednesday's. If Thursday had not been the day prior to a long weekend, we may well have seen higher volume and the 7th distribution day. On Monday, the distribution day of March 9 drops off the count and so the count will stand at 5. My instinct (for what its worth) is to count Thursday as a distribution day and to consider that an exit signal was issued. This is not the time to be taking long positions, although carefully chosen breakouts, held for short periods, can still be profitable.
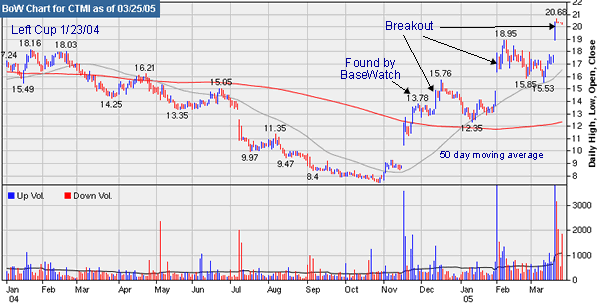
Inevitably, given the continued downward trend, there were fewer breakouts this week. The strongest performer was ATPL which broke out of a double-bottom base on 34 times average daily volume on Wednesday to gain 22.4% above its pivot before settling back for an 18.5% gain. On Monday, CTMI broke out of a cup-with-handle pattern with solid technical and fundamental strength and peaked at a 9.1% gain before settling back to a gain of 7.1%. This was the second strong breakout from a CwH pattern for CTMI in six-weeks and the third strong breakout since it first appeared on our basewatch list since when it has gained 47%. It is a good example of a stock that can form 2 or more handles as it progresses up the right side of its base and uses the 50 day moving average as a support level. In cases like these, blind use of an 8% stop-loss can lead to missing out on significant growth.

Although the market is trending down, we have not seen large losses by stocks breaking down from either ShortSaleWatch or a FlatBase pattern. We only started issuing breakdown alerts on March 1 this year, but we have back tested the ShortSale algorithm to January 1, and the results are presented in our Tip of the Week.
Oil and Gas-Drilling continued to be the best performing industry group.
| Index | Value | Change Week | Change YTD | Market1 Signal |
||||||||||||||||||||||||||||||||||||
|---|---|---|---|---|---|---|---|---|---|---|---|---|---|---|---|---|---|---|---|---|---|---|---|---|---|---|---|---|---|---|---|---|---|---|---|---|---|---|---|---|
| Dow | 10442.9 | -1.76% | -3.15% | enter | ||||||||||||||||||||||||||||||||||||
| NASDAQ | 1991.06 | -0.83% | -8.48% | exit | ||||||||||||||||||||||||||||||||||||
| S&P 500 | 1171.42 | -1.53% | -3.34% | enter | ||||||||||||||||||||||||||||||||||||
1The Market Signal is derived from our proprietary
market model. The market model is described on the site. 2The site also shows industry rankings based on fundamentals, combined technical and fundamentals, and on price alone (similar to IBD). The site also shows daily industry movements. |
||||||||||||||||||||||||||||||||||||||||
# of Breakouts
|
Period Average1
|
Max. Gain During Period2
|
Gain at Period Close3
|
|
|---|---|---|---|---|
| This Week | 12 | 23.62 | 4.48% | 1.65% |
| Last Week | 27 | 24.08 | 5.3% | -0.23% |
| 13 Weeks | 326 | N/A | 13.16% |
0.78% |
Sector
|
Industry
|
Breakout Count for Week
|
|---|---|---|
Banks
|
Banks-Midwest
|
1
|
Building
|
Building-Maint & Services
|
1
|
Building
|
Building-Heavy Constr
|
1
|
Chemical
|
Chemical-Plastics
|
1
|
Chemical
|
Chemical-Basic
|
1
|
Electronics
|
Electr-Equipment
|
1
|
Electronics
|
Electr-Connectors/Components
|
1
|
Electronics
|
Electr-Misc Products
|
1
|
Finance
|
Finance-Misc Services
|
1
|
Food
|
Food-Dairy Products
|
1
|
Healthcare
|
Healthcare-Drugs/Generic
|
1
|
Retail
|
Retail-Restaurant
|
1
|
2This represents the return if each stock were bought at its breakout price and sold at its intraday high.
3This represents the return if each stock were bought at its breakout price and sold at the most recent close.
Category |
Symbol |
Company Name |
Expected Gain1 |
|---|---|---|---|
| Best Overall | LMIA | LMI Aerospace, Inc. | 73 |
| Top Technical | NICK | Nicholas Financial, Inc. | 28 |
| Top Fundamental | NCI | Navigant Consulting, Inc. | 14 |
| Top Tech. & Fund. | NICK | Nicholas Financial, Inc. | 28 |
Category |
Symbol |
Company Name |
Expected Gain1 |
|---|---|---|---|
| Best Overall | LB | LaBarge, Inc. | 45 |
| Top Technical | LB | LaBarge, Inc. | 45 |
| Top Fundamental | GPN | Global Payments Inc. | 12 |
| Top Tech. & Fund. | LB | LaBarge, Inc. | 45 |
We added the ChartBrowser to ShortSaleWatch and started publishing a daily Breakdown Report of stocks that have broken down from our Flat Base watchlist and ShortsaleWatch. The ChartBrowser allows rapid viewing of each chart on the watch list.
How to use ShortsaleWatch to find suitable shorting candidates.
On February 20 this year we introduced a new service - ShortsaleWatch - which is based on the methodology described by William O'Neil in his book How to Make Money Selling Stocks Short with additional criteria based on our own research. With the markets in decline, there is naturally increasing interest in this service, so this week we revisit it and look at how it can be used to make profits selling stocks short.
The methodology used to select stocks for ShortsaleWatch is described here. For this analysis we recreated our ShortsaleWatch list back to January 3, 2005 and looked at all the breakdowns since that date. A 'breakdown' according to our definition occurs when the stock closes below support on at least 1.5 times average daily volume. Support is defined as either the 50 day moving average, or, if the stock was already below its 50 day moving average, its previous close. The following table shows the results obtained by breakdowns since the beginning of the year. There were 101 stocks selected for ShortsaleWatch and 22 confirmed breakdowns. The potential gains from short selling were quite modest. I think this is explained by the markets being in a consolidation rather than a confirmed bear market, the relatively short period of the study and the relatively small number of stocks found for ShortsaleWatch over the study period.
| Symbol | Breakdown Date | Support | Date of Min. Price since B/D | Min. Price | Max. Potential Short Sale Gain |
|---|---|---|---|---|---|
NTES | 01/20/05 | 50.48 | 02/11/05 | 37.55 | 25.61 % |
VRSN | 01/12/05 | 30.44 | 02/11/05 | 24.48 | 19.58 % |
AKAM | 02/04/05 | 12.61 | 02/17/05 | 10.64 | 15.62 % |
PH | 01/18/05 | 73.43 | 01/25/05 | 62.16 | 15.35 % |
DDS | 02/04/05 | 25.98 | 02/28/05 | 22.67 | 12.74 % |
UNA | 03/14/05 | 22.31 | 03/14/05 | 19.84 | 11.07 % |
CME | 03/02/05 | 210.54 | 03/09/05 | 188.8 | 10.33 % |
AGP | 03/10/05 | 38.75 | 03/24/05 | 34.75 | 10.32 % |
NLS | 01/13/05 | 22.16 | 01/13/05 | 20.25 | 8.62 % |
GT | 03/16/05 | 14.50 | 03/21/05 | 13.28 | 8.41 % |
PMTC | 03/08/05 | 5.66 | 03/23/05 | 5.2 | 8.13 % |
CNCT | 01/24/05 | 23.48 | 01/25/05 | 21.75 | 7.37 % |
AIRN | 02/10/05 | 4.74 | 02/11/05 | 4.41 | 6.96 % |
MNST | 03/15/05 | 29.46 | 03/24/05 | 27.43 | 6.89 % |
FORM | 03/16/05 | 23.12 | 03/21/05 | 21.53 | 6.88 % |
BJS | 02/01/05 | 47.04 | 02/07/05 | 44.19 | 6.06 % |
TLCV | 03/09/05 | 9.12 | 03/10/05 | 8.62 | 5.48 % |
ONXX | 02/24/05 | 29.79 | 02/24/05 | 28.32 | 4.93 % |
MGG | 03/23/05 | 75.00 | 03/24/05 | 71.6 | 4.53 % |
LTD | 03/22/05 | 23.81 | 03/24/05 | 23.34 | 1.97 % |
LGF | 02/22/05 | 9.86 | 02/22/05 | 9.74 | 1.22 % |
EXPD | 03/03/05 | 55.48 | 03/03/05 | 55.25 | 0.41 % |
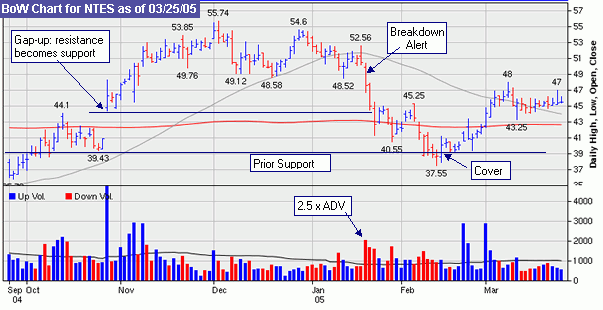
On the day of breakdown, we issue an alert if the stock falls below support and the projected volume at the end of the day (based on a straight line projection) is at least 1.5 times average volume. So in the case of NTES, we would have issued an alert in the morning of Jan. 20 giving a potential short sale price of $49. The stock subsequently performed as follows:

The difficult decision when short selling is deciding when to cover. As a general guideline, look for support levels and cover when they hold. We see that there was an initial support level at about $44.50 which it crashed through and then reversed to re-test that support level as resistance 9 days later. It didn't hold above that level and then crashed through the 200 day moving average line. The next prior support level was at 39, so we would have waited to see if that support level held, or was breached. Although it dipped well below that level intra-day it did recover and that would have been the point at which we would have decided to cover for a gain of $10 (20.4%).
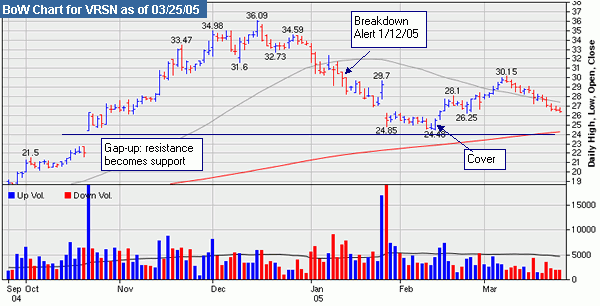
VRSN would have presented a similar situation, although in this case the short sale price following the alert would have been around $30 and the cover would have been at about $25 when it rebounded from the support level at 24.50 for a 16% gain.

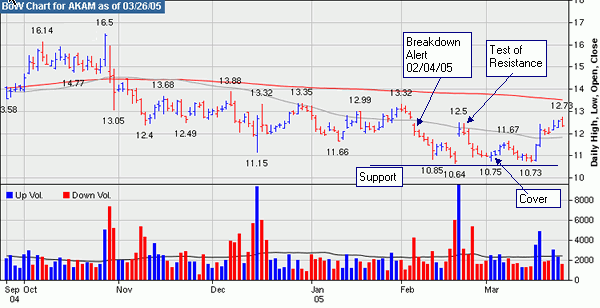
The third stock on the list represents a different situation. In the case of AKAM, there was no clear prior support level. A breakdown alert would have been issued on 02/04 and a short sale would have been entered at around $12.30. After dropping to $10.64, it would have taken some courage not to cover on the gap-up on 2/18. However, it closed below the 50 dma resistance level and re-tested that level again the next day, but again closed below it. The previous low of $10.64 was now the support level and when it failed to reach that level and recovered from the $10.75 level it would have been wise to cover. That level was tested again 9 days later giving a second confirmation to cover at around $11.00. Net gain on the transaction 10.6%.

Here are some suggestions for using the alerts from ShortsaleWatch:
- Short selling is risky because your potential loss is unlimited. When going long, the maximum amount you can lose is your initial investment, when shorting there is no limit to how high the stock can go from your entry level, so cover quickly when the stock moves against you.
- Review ShortsaleWatch prior to the market open and use the ChartBrowser to select stocks you would consider shorting if an alert is issued.
- Set a target cover price before you go short, using either a fixed percentage or an expected support level, and take profits at that level.
- If you go short on an alert and the stock recovers above the support level by the close, consider covering your position immediately.
- If you go short on an alert and the stock closes below the support price but volume doesn't meet the 1.5 times adv requirement, don't cover but wait for the action on the following day.
- After a confirmed breakdown a stock may recover to test the 50 dma resistance level - allow 2% overshoot before covering as the stock may breakdown again after testing resistance (see AKAM). If it holds at more than 2% above resistance, consider covering.
- Cover when a support level is tested and found to hold.
- Don't bet against the market.
[Disclosure: I have not personally used short sale alerts for my own trading. I undertook this analysis for my own benefit and these suggestions are based on my analysis of the results, review of the literature and the experiences of a my mentor - a former short sale hedge fund manager. I will be using these guidelines in the future for my personal trading when market conditions are appropriate, as I think they are now. These guidelines are offered for your consideration and any feedback or observations would be most welcome - Mike Gibbons]
If you received this newletter from a friend and you would like to receive it regularly please go to the BreakoutWatch.com site and enter as a Guest. You will then be able to register to receive the newsletter.
Copyright © 2005 NBIcharts, LLC dba BreakoutWatch.com. All rights reserved.