| Market Summary | Weekly Breakout Report | Top Breakout Choices | Top 2nd Chances | New Features | Tip of the Week |
Breakoutwatch.com Reviewed in Stocks & Commodities Magazine
 Technical
Analysis of Stocks & Commodities magazine editor, Jayanthi Gopalakrishnan,
reviewed breakout watch.com for the June issue of the magazine. You can read
the review here.
Technical
Analysis of Stocks & Commodities magazine editor, Jayanthi Gopalakrishnan,
reviewed breakout watch.com for the June issue of the magazine. You can read
the review here.
Market Summary
The markets closed higher this week with the DJI gaining 0.67%, the NASDAQ Composite 1.43% and the S&P 500, 0.8%. This was the fourth week in succession that the NASDAQ closed higher compared to just the second week in succession for the other two major indexes. The markets were encouraged this week by news that the economy was performing well after the Commerce Department revised GDP figures upwards for the first quarter, and that inflation was in check. The markets were held back somewhat, however, by a resumption of upward pressure on oil prices which caused some investors to lock in profits on Wednesday. The buyers were back on Thursday and although Friday got off to a bad start all three major indexes closed higher. The markets have sold off prior to holidays several times over the last three years fearing bad news could come in the longer period of market closure, so Friday's action was a testament to the resilience of the markets and underlying confidence heading into the long weekend.
The NASDAQ Composite rally shows few signs of weakness, though. Apart from volume levels being just below average, we still see the market moving higher. The NASDAQ recorded three accumulation days this week, making 10 in the 21 sessions since April 29, the start of the current rally, compared to just two distribution days. The NASDAQ now has the highest 'M' value (a weighted average of accumulation versus distribution days) of the three indexes and has recovered 50% of the year's losses. A weekly chart of the NASDAQ Composite shows that there is resistance looming at the 2100 level but that if it surmounts that then it could go on to approach its twelve month high set last December.
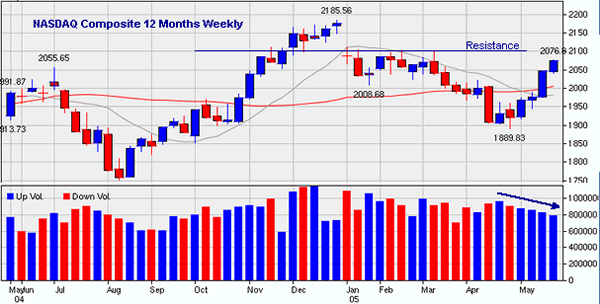
Look at the weekly volume bars and note how the volume has been going down each week since the rally began. If you were to look at weekly charts of the DJI and S&P 500, you would see a similar volume pattern. This indicates that the number of sellers is gradually drying up as they see that there is a potential to make more profit later. If demand was strong we would see increasing volume, but the supply is diminishing, so the net result is that prices are drifting up nevertheless. This is usually considered an indication that the upwards trend is weakening, but since this has been happening since the rally began, its hard to draw that conclusion here. Nevertheless it is an indication that the markets may have difficulty moving higher in the short term. On the other hand, if there were to be some unexpected good news, the lack of interest by sellers could cause the markets to move sharply higher.
Breakouts
The number of successful breakouts this week was 50% higher than the recent average and their average gains over the week of 2.8% comfortably beat the market averages. BOOM, already the best performing breakout of the year, made its third breakout since January and was the best performing breakout of the week, with a gain of 15.5% over its pivot after being 22.85% higher earlier. Other double digit gainers were TSA (10.86%), RATE (11.78%) and SYXI (10.74%).
Breakdowns
There were no breakdowns this week.
Industry Analysis
Healthcare-Hospitals continued to be the top performing industry as measured by our technical criteria although the sector produced only 3 breakouts this week. The honors for most breakouts went to Computer Software which produced 5 breakouts. The most improved industry was Retail-Mail Order which improved 38 places but is still ranked only 111 out of the 192 industries we track. Beverages-Soft Drink had the biggest 1 day gain on Friday, perhaps in anticipation of improved demand for refreshment as summer approaches.
Get a 14 day Trial of our premium 'Platinum' service for just $9.95 and if you subsequently subscribe to any subscription level we will credit your $9.95 to your subscription. 14
Day Platinum Trial |
Alerts based on personal watchlists went into effect on Monday.
We changed our default chart style to the candlestick style this week. You can learn how to interpret the many different signals sent by candlestick charts here.
Finding Stocks with Strong Earnings
The essence of the CANTATA methodology is to find stocks with strong fundamentals and then look for a valid entry point. We use our computer algorithms to turn that around and look for stocks with valid entry points and then provide the tools to examine their fundamentals. Our subscribers tell us this saves them vast quantities of time and they quickly earn back the cost of their subscriptions in higher returns and improved efficiency. But if you are more comfortable taking the more traditional approach, we can save you valuable amounts of time in that case also, because every stock traded on the NYSE, NASDAQ and AMEX exchanges is evaluated daily against CANTATA principles and the best scoring stocks can be found through our Database Search facility.
Suppose you want to find stocks with strong current earnings, a history of earnings growth over the last three years, have the potential for strong future earnings AND present a possible valid entry point. This is how to do it:
1. Under our Mine for Candidates menu choice, choose 'Database Search'.
2. You will be presented with a screen that looks like this (don't be discouraged, it may look complicated , but it is easy to use after you've followed this lesson):
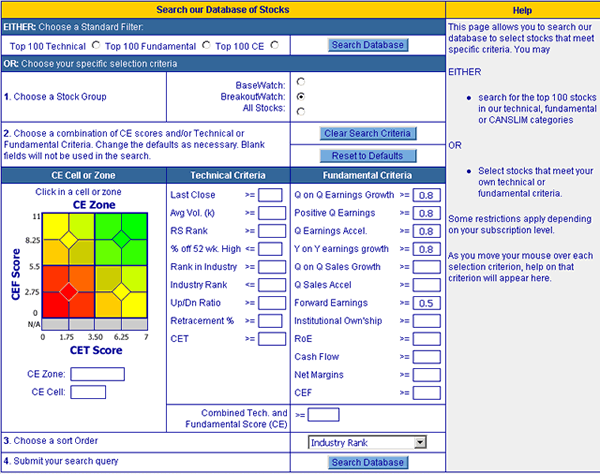
3. Follow these simple steps:
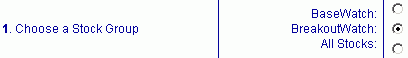
- Choose stocks that are ready to breakout
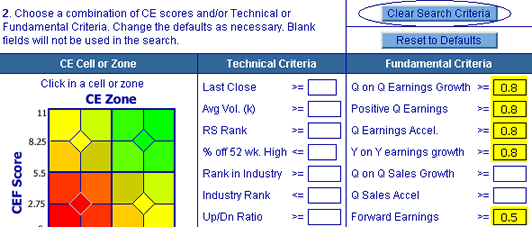
- Clear the default criteria and choose stocks ranked with the high levels
of earnings on our CANTATA Evaluator scale. As you move your mouse over each
criterion, the means of scoring each criterion is explained within the 'Help'
area of the screen.
- Select a sort order for the results:

- Start the Search

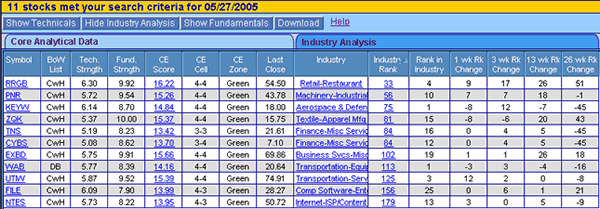
This would retrieve the following set of stocks, effective Friday, May 27, 2005
If you found this tip useful, you can see all our weekly tips in our Newsletter Archive
Get a 14 day Trial of our premium 'Platinum' service for just $9.95 and if you subsequently subscribe to any subscription level we will credit your $9.95 to your subscription. 14
Day Platinum Trial |
| Index | Value | Change Week | Change YTD | Market1 Signal |
||||||||||||||||||||||||||||||||||||
|---|---|---|---|---|---|---|---|---|---|---|---|---|---|---|---|---|---|---|---|---|---|---|---|---|---|---|---|---|---|---|---|---|---|---|---|---|---|---|---|---|
| Dow | 10542.5 | 0.67% | -2.23% | enter | ||||||||||||||||||||||||||||||||||||
| NASDAQ | 2075.73 | 1.43% | -4.58% | enter | ||||||||||||||||||||||||||||||||||||
| S&P 500 | 1198.78 | 0.8% | -1.08% | enter | ||||||||||||||||||||||||||||||||||||
1The Market Signal is derived from our proprietary
market model. The market model is described on the site. 2The site also shows industry rankings based on fundamentals, combined technical and fundamentals, and on price alone (similar to IBD). The site also shows daily industry movements. |
||||||||||||||||||||||||||||||||||||||||
# of Breakouts
|
Period Average1
|
Max. Gain During Period2
|
Gain at Period Close3
|
|
|---|---|---|---|---|
| This Week | 35 | 23.85 | 4.74% | 2.74% |
| Last Week | 55 | 23 | 6.54% | 3.91% |
| 13 Weeks | 372 | 25.69 | 8.83% |
0.93% |
Sector
|
Industry
|
Breakout Count for Week
|
|---|---|---|
Computer Software
|
Comp Software-Financial
|
2
|
Building
|
Building-Residentl/Comml
|
1
|
Building
|
Building-Products/Misc
|
1
|
Business Services
|
Business Svcs-Staffing
|
1
|
Chemical
|
Chemical-Specialty
|
1
|
Computer Software
|
Comp Software-Educ/Enter
|
1
|
Computer Software
|
Comp Software-Desktop
|
1
|
Computer Software
|
Comp Software-Security
|
1
|
Diversified Operations
|
Diversified Operations
|
1
|
Electronics
|
Electr-Semicndtr Mfg
|
1
|
Finance
|
Finance-Misc Services
|
1
|
Finance
|
Finance-Savings&Loan
|
1
|
Food
|
Food-Prepared
|
1
|
Healthcare
|
Healthcare-Biomed/Genetic
|
1
|
Healthcare
|
Healthcare-Instruments
|
1
|
Healthcare
|
Healthcare-Products
|
1
|
Internet
|
Internet-ISP/Content
|
1
|
Internet
|
Internet-Secur/Network Svcs
|
1
|
Leisure
|
Leisure-Services
|
1
|
Leisure
|
Leisure-Htls/Mtls
|
1
|
Leisure
|
Leisure-Products
|
1
|
Metal Prds
|
Metal Prds-Pipe/Fab/Misc
|
1
|
Oil & Gas
|
Oil & Gas-Prod/Pipeline
|
1
|
Pollution Control
|
Pollution Control-Services
|
1
|
Real Estate/ REIT
|
Real Estate Management
|
1
|
Retail
|
Retail-Misc/Diversified
|
1
|
Retail
|
Retail-Apparel
|
1
|
Special
|
Special-Market/Tracking Funds
|
1
|
Telecomm
|
Telecomm-Wireless Services
|
1
|
Telecomm
|
Telecomm-Equipment
|
1
|
Transportation
|
Transportation-Truck
|
1
|
Utility
|
Utility-Electric
|
1
|
Utility
|
Utility-Gas
|
1
|
2This represents the return if each stock were bought at its breakout price and sold at its intraday high.
3This represents the return if each stock were bought at its breakout price and sold at the most recent close.
Category |
Symbol |
Company Name |
Expected Gain1 |
|---|---|---|---|
| Best Overall | ABIX | ABATIX CORP | 120 |
| Top Technical | TALK | TALK AMERICA HLDGS INC | 98 |
| Top Fundamental | CLFC | CENTER FINL CORP CALIF | 60 |
| Top Tech. & Fund. | CTGI | CAPITAL TITLE GROUP INC | 89 |
Category |
Symbol |
Company Name |
Expected Gain1 |
|---|---|---|---|
| Best Overall | TMG | TRANSMONTAIGNE INC | 84 |
| Top Technical | ASFI | ASTA FDG INC | 55 |
| Top Fundamental | XXIA | IXIA | 68 |
| Top Tech. & Fund. | XXIA | IXIA | 68 |
If you received this newletter from a friend and you would like to receive it regularly please go to the BreakoutWatch.com site and enter as a Guest. You will then be able to register to receive the newsletter.
Copyright © 2005 NBIcharts, LLC dba BreakoutWatch.com. All rights reserved.