| Market Summary | Weekly Breakout Report | Top Breakout Choices | Top 2nd Chances | New Features | Tip of the Week |
Market Summary
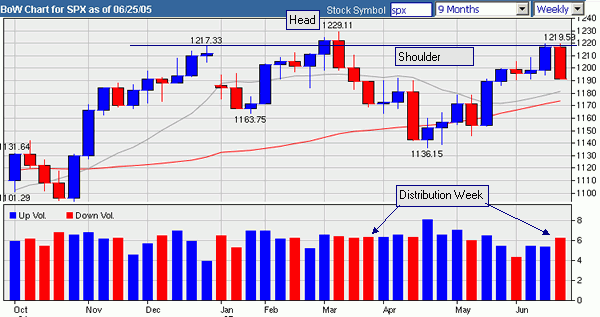
If a week is a long time in politics, it can be even longer in the travails of the market. Last week the markets brushed aside the fear of a continued rise in oil prices and became greedy on the prospects of contained inflation and lowered prospects of interest rate rise. This week the fear returned as oil prices reached record highs, earnings were brought back into focus as Federal Express missed profit expectations and blamed higher energy costs, durable goods orders declined (when removing aircraft sales and military orders from the statistics) and the markets responded with their worst week of declines since mid-April. The DJI lost 3.06%, the S&P 500 lost 2.09%, and the NASDAQ Composite was the least hardest hit with a loss of 2.09%. The recent trend of lower than average volume was reversed and the markets suffered their first distribution week since late March.
The generally accepted broadest market index is the S&P 500. We drew attention to it being in a bearish head and shoulders pattern two weeks ago and last week it looked as though it had broken through the shoulder line to reach a new recent high. But this week we see the bearishness was confirmed as the right shoulder breakout failed.

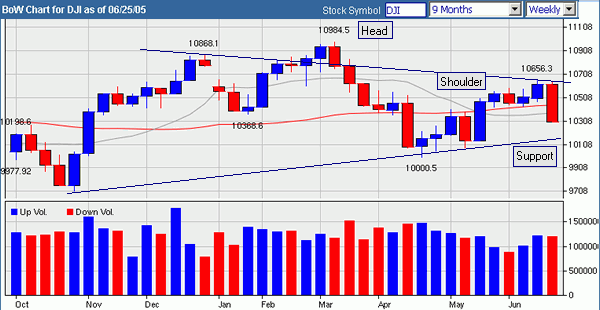
While this pattern is not encouraging, it is worth noting that the S&P 500 is still above the 50 and 200 day moving average lines, which are still trending up. This is not the case with the DJI, which is also in a head and shoulders with a downward sloping right shoulder which is even more bearish. In addition the DJI is below both its 50 and 200 day moving average lines which are flat. It could fall another 100 points before reaching support.

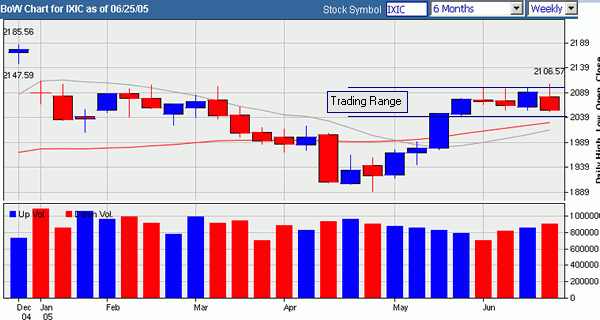
The NASDAQ Composite has been testing the 2100 level and broke through it on Thursday to reach 2106 before suffering a strong reversal. The result was an 'Outside Day' where both the high and the low exceeded the previous day's values. This is usually a bearish signal but a review of the chart shows that the NASDAQ is the least weakened of the major indexes.It is near the bottom of its recent trading range after turning up slightly at the close on Friday but is still above the 50 and 200 day moving average lines.

Breakouts
There were 34 confirmed breakouts this week that had gained an average of 1.97% by the week's close - a substantial gain over the market averages. We continued to see examples of strong breakouts following an uptick in price and volume that we drew attention to in our 4/23/05 Newsletter. A case in point is UNA, which gapped up on Thursday to gain 19.3% before closing the week for a gain of 14.95%.The previous two days had seen gains on increasing volume. An even more impressive example was SPIR which broke out on Monday and gained 43.92% by Tuesday.
Breakdowns
Fridays decline brought a spate of 13 breakdown alerts with 4 confirmed at the end of the session. FLSH lost 5% and CKR 5.7%.
Industry Analysis
Oil and gas continued to be the top performing industry group with Pollution Control Equipment being the most improved. The Oil and Gas sector produced 5 breakouts, tying with the second best performing sector - Healthcare.
Filter Competition
Our filter competition is off and running. Everyone can play and the prize is a 90 day Platinum Subscription worth $270. See our Top Tip for details.
Get a 14 day Trial of our premium 'Platinum' service for just $9.95 and if you subsequently subscribe to any subscription level we will credit your $9.95 to your subscription. 14
Day Platinum Trial |
The logic operators for filtering the Core Indicators can now be toggled between '<=' and '>='.
A constraint of our filtering approach in the past was that the logic operators used for filtering were pre-selected and could not be changed. While these were the most useful in most cases, it meant, for example, that you could filter to include stocks that closed at at least, say, $15, but not filter to include only stocks that closed at less than $15.
This has now changed, and you can toggle the logic operators between '>=' and '<=' by clicking the operator with your mouse. When you save your filters, the logic operators are saved along with them. This feature is limited to the 'Core Indicators' section of the CwH list for the time being. The clickable logical operators are shown against a gray background, whereas the non-clickable ones are against a blue background as the following image shows.

Filter Competition
As announced last week, we are running a competition to find the filters that produced the best returns over the last 3 months as determined by our backtest program. This competition is open to all subscribers. Normally filters are only available to Trial and Platinum subscribers, but we have opened up the use of filters to Silver and Gold subscribers between now and the close of the competition at midnight EST on June 30.
Two 90 day Platinum subscriptions will be awarded to the subscribers who develop the set of filters that produce the best breakout day close returns and best longer term gains based on the filters that they have saved as of midnight EST on June 30.
We will take all the saved filters as of June 30 and run them through the backtest program to select the set of filters that produces:
- The largest positive variance in the 'Average Gain at B/O Day Close' column
- The largest positive variance in the 'Average Max Gain since B/O'' column.
- Your filters must select at least 60 stocks (an average of approximately 1 per trading day) out of the breakouts over the last 3 months (the backtest period). This is to ensure a reasonable supply of alerts to act on, or not.
In the event of a tie, the 90 days will be divided between the winners. Winners will be notified by email and the winning filters will be announced in the newsletter of Saturday, July 1.
The 90 day Platinum subscription will be awarded as an extension to existing Platinum and Trial subscriptions, and Gold and Silver subscriptions will be converted to Platinum for 90 days, after which they will revert to Gold or Silver with their expiry date extended by 90 days.
For more information on the backtest feature, see last week's newsletter.
Get a 14 day Trial of our premium 'Platinum' service for just $9.95 and if you subsequently subscribe to any subscription level we will credit your $9.95 to your subscription. Win our filter competition and get a 90 day free Platinum subscription. 14
Day Platinum Trial |
| Index | Value | Change Week | Change YTD | Market1 Signal |
||||||||||||||||||||||||||||||||||||
|---|---|---|---|---|---|---|---|---|---|---|---|---|---|---|---|---|---|---|---|---|---|---|---|---|---|---|---|---|---|---|---|---|---|---|---|---|---|---|---|---|
| Dow | 10297.8 | -3.06% | -4.5% | enter | ||||||||||||||||||||||||||||||||||||
| NASDAQ | 2053.27 | -1.76% | -5.62% | enter | ||||||||||||||||||||||||||||||||||||
| S&P 500 | 1191.57 | -2.09% | -1.68% | enter | ||||||||||||||||||||||||||||||||||||
1The Market Signal is derived from our proprietary
market model. The market model is described on the site. 2The site also shows industry rankings based on fundamentals, combined technical and fundamentals, and on price alone (similar to IBD). The site also shows daily industry movements. |
||||||||||||||||||||||||||||||||||||||||
# of Breakouts
|
Period Average1
|
Max. Gain During Period2
|
Gain at Period Close3
|
|
|---|---|---|---|---|
| This Week | 34 | 29.85 | 5.96% | 1.97% |
| Last Week | 56 | 28.08 | 6.55% | 1.03% |
| 13 Weeks | 425 | 30.62 | 11.78% |
4.39% |
Sector
|
Industry
|
Breakout Count for Week
|
|---|---|---|
Healthcare
|
Healthcare-Products
|
3
|
Insurance
|
Insurance-Prop/Casualty/TItl
|
3
|
Oil & Gas
|
Oil & Gas-U S Explr/Prod
|
3
|
Healthcare
|
Healthcare-Biomed/Genetic
|
2
|
Telecomm
|
Telecomm-Wireless Services
|
2
|
Aerospace & Defense
|
Aerospace & Defense-Electr
|
1
|
Aerospace & Defense
|
Aerospace & Defense-Mfg
|
1
|
Banks
|
Banks-Money Center
|
1
|
Computer
|
Computer-Services
|
1
|
Electronics
|
Electr-Semicndtr Mfg
|
1
|
Energy
|
Energy-Other Sources
|
1
|
Finance
|
Finance-Invest Management
|
1
|
Food
|
Food-Candy
|
1
|
Internet
|
Internet-ISP/Content
|
1
|
Leisure
|
Leisure-Htls/Mtls
|
1
|
Machinery
|
Machinery-Industrial
|
1
|
Metal Prds
|
Metal Prds-Pipe/Fab/Misc
|
1
|
Office
|
Office-Supplies
|
1
|
Oil & Gas
|
Oil & Gas-Field Services
|
1
|
Oil & Gas
|
Oil & Gas-Drilling
|
1
|
Pollution Control
|
Pollution Control-Equip
|
1
|
Real Estate/ REIT
|
Real Estate-REIT
|
1
|
Retail
|
Retail-Home Furnishings
|
1
|
Retail
|
Retail-Apparel
|
1
|
Telecomm
|
Telecomm-Services Fgn
|
1
|
Utility
|
Utility-Gas
|
1
|
2This represents the return if each stock were bought at its breakout price and sold at its intraday high.
3This represents the return if each stock were bought at its breakout price and sold at the most recent close.
Category |
Symbol |
Company Name |
Expected Gain1 |
|---|---|---|---|
| Best Overall | PRFT | PERFICIENT INC | 119 |
| Top Technical | TALK | TALK AMERICA HLDGS INC | 94 |
| Top Fundamental | SPN | SUPERIOR ENERGY SVCS INC | 65 |
| Top Tech. & Fund. | SPN | SUPERIOR ENERGY SVCS INC | 65 |
Category |
Symbol |
Company Name |
Expected Gain1 |
|---|---|---|---|
| Best Overall | FTEK | FUEL-TECH N V | 110 |
| Top Technical | ACU | ACME UTD CORP | 81 |
| Top Fundamental | CDIS | CAL DIVE INTL INC | 58 |
| Top Tech. & Fund. | CDIS | CAL DIVE INTL INC | 58 |
If you received this newletter from a friend and you would like to receive it regularly please go to the BreakoutWatch.com site and enter as a Guest. You will then be able to register to receive the newsletter.
Copyright © 2005 NBIcharts, LLC dba BreakoutWatch.com. All rights reserved.