| Market Summary | Weekly Breakout Report | Top Breakout Choices | Top 2nd Chances | New Features | Tip of the Week |
Market Summary
A minor rally on Friday still left the markets with their biggest weekly losses for some time on heavy volume. The DJI had its worst week since June, while we have to go back to April to find a bigger weekly drop for the NASDAQ and S&P 500. For the week, the DJI lost 2.62%, the NASDAQ dropped 2.85% and the S&P 500 gave up 2.68%. Our market model signaled an entry for the NASDAQ on Monday after the index experienced a follow through day, but reversed itself on Tuesday when it fell 0.75% on very heavy volume. We review the mechanics of the market model in this weeks top tip below.
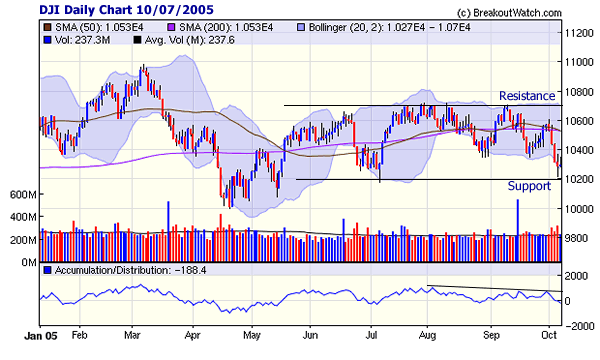
A glance at the charts of the major indexes shows that the markets are in serious difficulties. The DJI has been under distribution since August and is well below both its 50 and 200 day moving averages and found support this week at the 10200 level last seen in July. A breakdown below that level could see the DJI hit 10000 before it recovers.

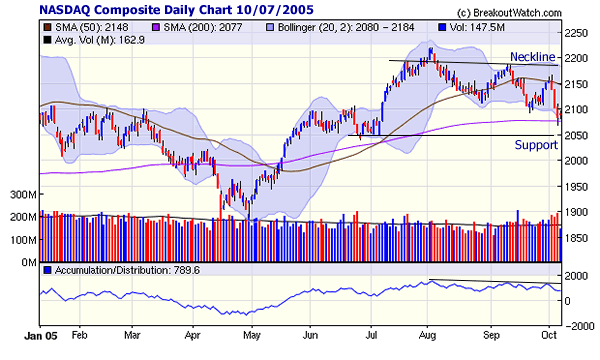
We have previously pointed out that the NASDAQ has completed a bearish head-and-shoulders pattern and in late September it attempted to rally back to the neckline of that pattern but could not convincingly clear the 50 day moving average level. This week it found support at the 200 day moving average level, but if that doesn't hold, then we could see a fall to 2050.

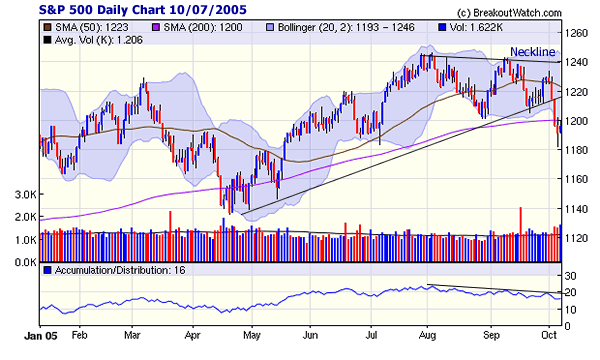
The S&P 500 chart is similar to the NASDAQ's with a failure to recover above the neckline of a head-and-shoulders pattern. On Tuesday, the index fell through the 50 day moving average for the third time on above average volume, a signal that breakdown was imminent, and went on to break the low trend line also. It then failed to find support at the 200 day moving average level and intra-day on Thursday dipped to its lowest level, 1182, since May. We could see a retest of that support level in the coming week.

Although breakouts were fewer, there were still some outperformers. SMTS (Somantecs) gained 16.45% before closing for a gain of 7.85% over its pivot and BEAV (BE Aerospace) rose 7.6% before closing for a gain of 5.2%.
Our breakdown alerts are based on the methods described in William O'Neil's 'How to Make Money Selling Stocks Short'. An alert is issued when a stock breaks down through its 50 day moving average and there was a lot of breakdown action this week with 20 confirmed breakdowns (Stocks that closed below the 50 dma on at least 1.5 times average volume).
Get a 14 day Trial of our premium 'Platinum' service for just $9.95 and if you subsequently subscribe to any subscription level we will credit your $9.95 to your subscription. 14
Day Platinum Trial |
There were no new features added this week.
Our market model reversed itself twice this week, first saying 'enter' on Monday and then 'exit' on Tuesday. Since 'M' is quite important, this week we are going to look again at how the market model works.
Firstly, it is interesting to note that there are approximately 45% more successful breakouts when our model signals 'Enter' than when it signals 'Exit', so clearly, there are many more oppportunities to make profits during the 'Enter' periods. Here is the data for this year.
| NASDAQ Market Enter Signals | |||
From |
To |
No. Breakouts |
No. Days |
|---|---|---|---|
5/4/2005 |
7/6/2005 |
302 |
43 |
7/8/2005 |
8/30/2005 |
207 |
37 |
9/6/2005 |
9/20/2005 |
58 |
10 |
10/3/2005 |
10/4/2005 |
2 |
1 |
Totals |
569 |
91 |
|
Average Breakouts per Day |
6.25 |
||
| NASDAQ Market Exit Signals | |||
From |
To |
No. Breakouts |
No. Days |
|---|---|---|---|
01/04/05 |
5/4/2005 |
329 |
83 |
7/6/2005 |
7/8/2005 |
26 |
2 |
8/30/2005 |
9/6/2005 |
11 |
4 |
9/20/2005 |
10/3/2005 |
55 |
9 |
Totals |
421 |
98 |
|
Average Breakouts per Day |
4.30 |
||
You are probably also interested in knowing how the market model performed this year. The model signaled 'exit' on January 4, the second trading day of the year and did not signal enter until May 5. If you had bought the NASDAQ Composite at the open on the day following each 'enter' signal and sold it at the open after each 'exit' signal, then your returns would have been as follows:
Signal | Signal Date | Trade | Trade Date | Buy | Sell | Profit | % Profit |
Cumulative |
|---|---|---|---|---|---|---|---|---|
Exit | 1/4/2005 | |||||||
enter | 5/4/2005 | Buy | 5/5/2004 | 1960.38 | ||||
exit | 7/6/2005 | Sell | 7/7/2005 | 2050.71 | 90.33 | 4.61 |
4.61% | |
enter | 7/8/2005 | Buy | 7/11/2005 | 2115.98 | ||||
exit | 8/30/2005 | Sell | 8/31/2005 | 2130.81 | 14.83 | 0.70 |
5.34% | |
enter | 9/6/2005 | Buy | 9/7/2005 | 2164.14 | ||||
exit | 9/20/2005 | Sell | 9/21/2005 | 2129.96 | -34.18 | -1.58 |
3.67% | |
enter | 10/3/2005 | Buy | 10/4/2005 | 2156.26 | ||||
exit | 10/4/2005 | Sell | 10/5/2005 | 2139.16 | -17.1 | -0.79 |
2.85% |
For the year overall, the NASDAQ has lost 3.9%.
How the Model Works.
Each day after the market closes we look at the market movement for the day and assess wether the current signal should change.
If the current signal is 'enter', then we count the number of distribution days for each of the three major indexes over the last few trading sessions. We will issue an 'exit' signal if the number of distribution days exceeds a threshold as follows:
| Distribution Day Thresholds for Exit Signals | ||
Index |
Distribution Days |
No. Of Sessions |
|---|---|---|
DJI |
7 |
12 |
NASDAQ |
5 |
15 |
S&P 500 |
9 |
18 |
If the current signal is 'Exit', then we look for the day on which the index set its lowest intraday low since the last exit signal was issued and closed above that low. We'll call that 'day 1' of the recovery since it closed above the lowest low. We then look for a follow through day where the index closed at least 1.5% above the close on 'day 1' and volume exceeded the previous day's volume (an accumulation day). That follow through day must occur within a certain minumum and maximum number of days after day 1 as follows:
| Follow Through Day Limits | ||
Index
|
Minimum Day No.
|
Maximum Day No.
|
|---|---|---|
DJI
|
4 |
7 |
NASDAQ
|
4 |
10 |
S&P 500
|
4 |
9 |
There is also an additional requirement that the close must be at least 0.05% above its 200 day moving average.
You can review how the model performed in 2004 by looking at the newsletter archive for 01/08/2005. There is also more information here.
Investment Advisors Using our Service
If you are interested in basing part of your investment strategy on our service, but do not have the time, experience or confidence to do so on your own account, then consider using an investment advisor.
TradeRight Securities, located in a suburb of Chicago, is a full services investment management company and broker/dealer. They have been a subscriber, and user, of BreakoutWatch.com for some time now. They practice CANTATA and use Breakoutwatch.com as a “research analyst”.
They also provide:
• A hands-on approach through personalized service
•
On-going communication, guidance, and consultation
•
An environment that working together with their clients will help them reach
their financial goals
You can learn more about TradeRight Securities at: www.traderightsecurities.com.
If you’re interested
in speaking to a representative, simply call them toll-free at 1-800-308-3938
or e-mail gdragel@traderightsecurities.com.
Get a 14 day Trial of our premium 'Platinum' service for just $9.95 and if you subsequently subscribe to any subscription level we will credit your $9.95 to your subscription. 14
Day Platinum Trial |
| Index | Value | Change Week | Change YTD | Market1 Signal |
||||||||||||||||||||||||||||||||||||
|---|---|---|---|---|---|---|---|---|---|---|---|---|---|---|---|---|---|---|---|---|---|---|---|---|---|---|---|---|---|---|---|---|---|---|---|---|---|---|---|---|
| Dow | 10292.3 | -2.62% | -4.55% | enter | ||||||||||||||||||||||||||||||||||||
| NASDAQ | 2090.35 | -2.85% | -3.91% | exit | ||||||||||||||||||||||||||||||||||||
| S&P 500 | 1195.9 | -2.68% | -1.32% | enter | ||||||||||||||||||||||||||||||||||||
1The Market Signal is derived from our proprietary
market model. The market model is described on the site. 2The site also shows industry rankings based on fundamentals, combined technical and fundamentals, and on price alone (similar to IBD). The site also shows daily industry movements. |
||||||||||||||||||||||||||||||||||||||||
# of Breakouts
|
Period Average1
|
Max. Gain During Period2
|
Gain at Period Close3
|
|
|---|---|---|---|---|
| This Week | 34 | 31.38 | 2.53% | -2.38% |
| Last Week | 40 | 32.38 | 5.41% | -0.95% |
| 13 Weeks | 463 | 34.31 | 12.72% |
0.69% |
Sector
|
Industry
|
Breakout Count for Week
|
|---|---|---|
Banks
|
Banks-Foreign
|
2
|
Healthcare
|
Healthcare-Instruments
|
2
|
Real Estate/ REIT
|
Real Estate-REIT
|
2
|
Aerospace & Defense
|
Aerospace & Defense-Equip
|
1
|
Banks
|
Banks-Southeast
|
1
|
Chemical
|
Chemical-Specialty
|
1
|
Computer
|
Computer-Peripheral Equip
|
1
|
Computer Software
|
Comp Software-Desktop
|
1
|
Computer Software
|
Comp Software-Enterprise
|
1
|
Diversified Operations
|
Diversified Operations
|
1
|
Energy
|
Energy-Other Sources
|
1
|
Finance
|
Finance-Consumer Loans
|
1
|
Healthcare
|
Healthcare-Med/Dent Services
|
1
|
Healthcare
|
Healthcare-Outpnt/HmCare
|
1
|
Healthcare
|
Healthcare-Drugs/Diversified
|
1
|
Healthcare
|
Healthcare-Drugs/Ethical
|
1
|
Healthcare
|
Healthcare-Nursing Homes
|
1
|
Insurance
|
Insurance-Prop/Casualty/TItl
|
1
|
Leisure
|
Leisure-Services
|
1
|
Machinery
|
Machinery-Const/Mining
|
1
|
Media
|
Media-Books
|
1
|
Metal Prds
|
Metal Prds-Distributors
|
1
|
Personal
|
Personal-Soap & Clng
|
1
|
Personal
|
Personal -Cosmetics
|
1
|
Personal
|
Personal-Shoes
|
1
|
Retail
|
Retail-Major Disc Chains
|
1
|
Special
|
Special-ClsdEndFunds/Bond
|
1
|
Telecomm
|
Telecomm-Services Fgn
|
1
|
Utility
|
Utility-Gas
|
1
|
2This represents the return if each stock were bought at its breakout price and sold at its intraday high.
3This represents the return if each stock were bought at its breakout price and sold at the most recent close.
Category |
Symbol |
Company Name |
Expected Gain1 |
|---|---|---|---|
| Best Overall | BIOV | BioVeris Corp. | 83 |
| Top Technical | CPTS | CONCEPTUS INC | 53 |
| Top Fundamental | LIFE | LIFELINE SYS INC | 14 |
| Top Tech. & Fund. | HITK | HI-TECH PHARMACAL INC | 36 |
Category |
Symbol |
Company Name |
Expected Gain1 |
|---|---|---|---|
| Best Overall | SLXP | SALIX PHARMACEUTICALS INC | 48 |
| Top Technical | CRDN | CERADYNE INC CALIF | 47 |
| Top Fundamental | NNDS | NDS GROUP PLC | 29 |
| Top Tech. & Fund. | NNDS | NDS GROUP PLC | 29 |
If you received this newletter from a friend and you would like to receive it regularly please go to the BreakoutWatch.com site and enter as a Guest. You will then be able to register to receive the newsletter.
Copyright © 2005 NBIcharts, LLC dba BreakoutWatch.com. All rights reserved.