| Market Summary | Weekly Breakout Report | Top Breakout Choices | Top 2nd Chances | New Features | Tip of the Week |
Market Summary
Entering into this week, investors were anxious that the new year rally could not be maintained unless 4th quarter earnings at least met analysts' expectations. Their anxiety was raised on Wednesday when Yahoo and Intel failed to meet expectations but allayed on Thursday when eBay and AMD reported solid earnings. Gloom spread across the markets on Friday, though, as GE and Citigroup disappointed and crude oil prices rose sharply in response to the Iran situation and Al Qaeda threats. There was no respite during the day FRiday as the markets fell all day to close at or near their lows. The result for the week was heavy losses for the major indexes as the DJI lost 2.67% to close lower for the year, the NASDAQ lost 2.99% leaving it just 1.92% higher for the year after reaching almost 5% on January 11 and the S&P 500 gave up 2.03% leaving it just 1.06% higher for the year.
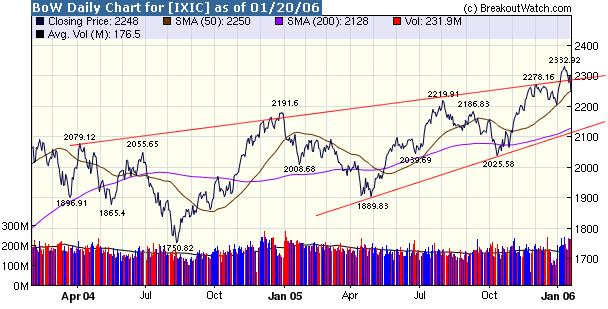
Turning to the situation on the NASDAQ we see a bearish picture emerge. The
index has now crashed through the rising wedge pattern that it rode
above for so long. It has also broken through the most recent support level
at 2332 and fallen to just below its 50 day moving average.

To understand where it might go next, our models give a conflicting picture.
On the one hand, our market model is still
signaling 'enter' as there have been only two distribution days in
the last
fifteen sessions
(and only one this year) whereas our sell model issued a sell signal after
Friday's close. I am going to put more reliance on the market model because
I understand the models' inner workings.
The number of successful breakouts from our watchlists dropped slightly to 40 this week and the average gain by weeks end was a losing -0.2% although still very comfortably outperforming the major indexes.
Our new TradeWatch lists are performing very well. Our TradeWatch Best Return list has averaged a 9.8% return since the start of the year.
Machinery Construction/Mining again topped our list of top ranked industries based on our Technical Criteria while Auto & Truck Replacement Parts was the most improved industry in our rankings.
Get a 14 day Trial of our premium 'Platinum' service for just $9.95 and if you subsequently subscribe to any subscription level we will credit your $9.95 to your subscription. 14
Day Platinum Trial |
Sell Alert Enhancements
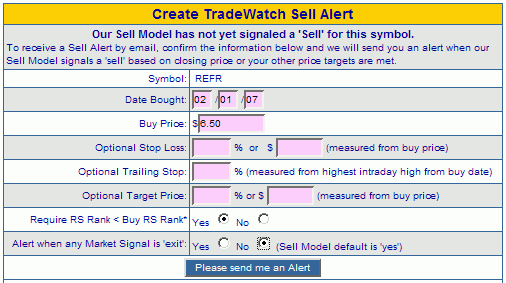
You now have the option of entering a stop loss and/or a target price into our sell alert service. Each day after the market closes we will compare the closing price to your stop loss and/or target price for the stock and if either is met we will send an email alert. If they are not met, or you didn't specify either or both, we will check our Sell Model's and send an alert if that signals sell.

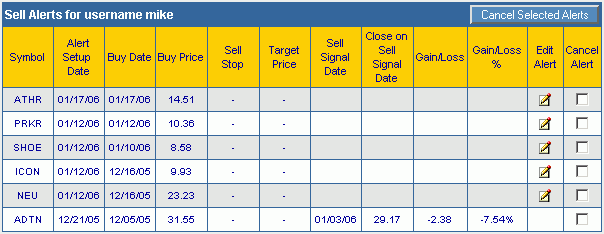
You can check the status of your sell alerts and edit them from the TradeWatch 'Sell Alerts' menu choice by clicking the 'Edit Alert' icon.

TradeWatch Revised Documentation
Coinciding with the release of the enhanced Sell Alert functionality, we have fully revised and brought up to date the documentation on TradeWatch. Our TradeWatch Best Return stocks are showing an average return of 9.8% since the start of the year even after Friday's debacle, so you really should consider subscribing to this service.
- Overview
- TradeWatch
- TradeWatch History
- TradeWatch Assistant
- TradeWatch Sell Alerts
- Sell Model
- Sell Model Methodology
- Subscription and Pricing
Investment Advisors Using our Service
If you would like to be listed here, please contact us. As a service to those who support us, there is no additional charge to be listed here.
TradeRight Securities, located in a suburb of Chicago, is a full services investment management company and broker/dealer. They have been a subscriber, and user, of BreakoutWatch.com for some time now. They practice CANTATA and use Breakoutwatch.com as a “research analyst”. You can learn more about TradeRight Securities at: www.traderightsecurities.com. If you’re interested in speaking to a representative, simply call them toll-free at 1-800-308-3938 or e-mail gdragel@traderightsecurities.com.
Get a 14 day Trial of our premium 'Platinum' service for just $9.95 and if you subsequently subscribe to any subscription level we will credit your $9.95 to your subscription. 14
Day Platinum Trial |
| Index | Value | Change Week | Change YTD | Market1 Signal |
||||||||||||||||||||||||||||||||||||
|---|---|---|---|---|---|---|---|---|---|---|---|---|---|---|---|---|---|---|---|---|---|---|---|---|---|---|---|---|---|---|---|---|---|---|---|---|---|---|---|---|
| Dow | 10667.4 | -2.67% | -0.47% | enter | ||||||||||||||||||||||||||||||||||||
| NASDAQ | 2247.7 | -2.99% | 1.92% | enter | ||||||||||||||||||||||||||||||||||||
| S&P 500 | 1261.49 | -2.03% | 1.06% | enter | ||||||||||||||||||||||||||||||||||||
1The Market Signal is derived from our proprietary
market model. The market model is described on the site. 2The site also shows industry rankings based on fundamentals, combined technical and fundamentals, and on price alone (similar to IBD). The site also shows daily industry movements. |
||||||||||||||||||||||||||||||||||||||||
# of Breakouts
|
Period Average1
|
Max. Gain During Period2
|
Gain at Period Close3
|
|
|---|---|---|---|---|
| This Week | 40 | 34.69 | 3.57% | -0.21% |
| Last Week | 44 | 34.08 | 6.67% | 1.88% |
| 13 Weeks | 504 | 36.46 | 14.64% |
6.92% |
Sector
|
Industry
|
Breakout Count for Week
|
|---|---|---|
Banks
|
Banks-Super Regional
|
4
|
Electronics
|
Electr-Semicndtr Equip
|
3
|
Healthcare
|
Healthcare-Biomed/Genetic
|
3
|
Finance
|
Finance-Brokers
|
2
|
Special
|
Special-Market/Tracking Funds
|
2
|
Building
|
Building-Residentl/Comml
|
1
|
Building
|
Building-Heavy Constr
|
1
|
Chemical
|
Chemical-Basic
|
1
|
Computer
|
Computer-Storage Devices
|
1
|
Computer
|
Computer-Integrated Sys
|
1
|
Electronics
|
Electr-Semicndtr Mfg
|
1
|
Electronics
|
Electr-Measuring Instruments
|
1
|
Healthcare
|
Healthcare-Instruments
|
1
|
Healthcare
|
Healthcare-Drugs/Ethical
|
1
|
Insurance
|
Insurance-Prop/Casualty/TItl
|
1
|
Internet
|
Internet-ISP/Content
|
1
|
Leisure
|
Leisure-Gaming
|
1
|
Leisure
|
Leisure-Services
|
1
|
Leisure
|
Leisure-Movies & Related
|
1
|
Machinery
|
Machinery-Industrial
|
1
|
Media
|
Media-Cable/Satellite TV
|
1
|
Metal Prds
|
Metal Prds-Distributors
|
1
|
Mining
|
Mining-Misc Ores
|
1
|
Oil & Gas
|
Oil & Gas-U S Explr/Prod
|
1
|
Oil & Gas
|
Oil & Gas-Drilling
|
1
|
Personal
|
Personal-Funeral Services
|
1
|
Personal
|
Personal -Cosmetics
|
1
|
Retail
|
Retail-Home Furnishings
|
1
|
Telecomm
|
Telecomm-Equipment
|
1
|
2This represents the return if each stock were bought at its breakout price and sold at its intraday high.
3This represents the return if each stock were bought at its breakout price and sold at the most recent close.
Category |
Symbol |
Company Name |
Expected Gain1 |
|---|---|---|---|
| Best Overall | APLX | APPLIX INC | 100 |
| Top Technical | RCCC | Rural Cellular Corp. | 35 |
| Top Fundamental | TOMO | TOM Online Inc. | 36 |
| Top Tech. & Fund. | TOMO | TOM Online Inc. | 36 |
Category |
Symbol |
Company Name |
Expected Gain1 |
|---|---|---|---|
| Best Overall | LANV | LANVISION SYS INC | 94 |
| Top Technical | LANV | LANVISION SYS INC | 94 |
| Top Fundamental | PARL | PARLUX FRAGRANCES INC | 0 |
| Top Tech. & Fund. | DXPE | DXP ENTERPRISES INC NEW | 79 |
If you received this newletter from a friend and you would like to receive it regularly please go to the BreakoutWatch.com site and enter as a Guest. You will then be able to register to receive the newsletter.
Copyright © 2006 NBIcharts, LLC dba BreakoutWatch.com. All rights reserved.