| Market Summary | Weekly Breakout Report | Top Breakout Choices | Top 2nd Chances | New Features | Tip of the Week |
Market Summary
Investors were disappointed this week when the Federal Reserve failed to signal
that interest rate increases were at an end. Although Tuesday's statement
from the Open Markets Committee implied that further increases may be necessary
rather than affirming that they would be necessary, there were indications
on Thursday that inflationary pressures may be building through reduced productivity
which left investors much less certain that interest rate increases were over
for now. This coincided with two high profile companies, Google amd Amazon,
missing their earnings expectations and the major indexes dropped sharply
on Thursday and Friday. The result was the second losing week for the year
with the DJI dropping back 1.04%, the NASDAQ Composite losing 1.81% and the
S&P 500 slipping 1.53%.
The NASDAQ Composite slipped below its 50 day moving average on Friday and
remained there at the close. We may see it drop further to the 1/23 support
level of 2241 shortly. The index suffered two distribution days this week bringing
the distribution day
count,
by our
reckoning
as of
the market
close on Friday, to four in the last 13 days. However, a newsletter subscriber
has pointed out that Yahoo shows 1/20 as a distribution day and after checking
with other sources we have updated our data and concluded that
the correct count is five distribution days. Our market model now says 'exit' so
we advise liquidating weak positions and only taking new positions in strong
candidates
(such as those on our TradeWatch Best Return list). Another distribution day
was narrowly averted on Friday as volume slipped just below
Thursday's. Our
interpretation of distribution days is shown in our market equivolume chart
which neatly summarises the major daily market movements.
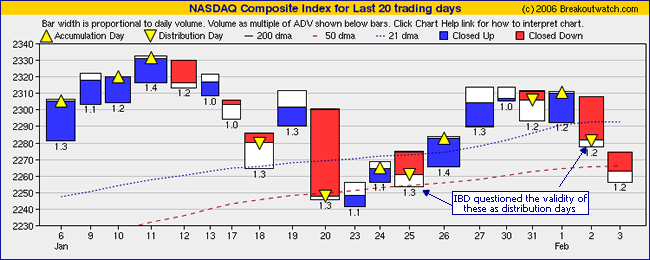
There is some uncertainty as to what the distribution day count actually is. IBD has diminished the importance of the 1/25 and 2/2 distribution days. On 1/26 it said "IBD counts distribution days on the market when the major indexes notch a significant decline in heavier trade. A mild 0.2% loss doesn't fit that description". But when they did get heavier trade as on 2/2 they said "The higher volume marked a distribution day for the Nasdaq by the letter of the rule. But you might have expected a more pronounced surge in volume given the size of the market's losses." This leaves us wondering what they consider a 'significant' price change and a 'pronounced' volume change? Investors.com defines distribution as "Distribution in the stock market refers to the selling of stock by large institutions. Distribution is indicated by one or more of the major market indexes closing down on increased volume from the previous day." That seems pretty clear and that's the definition we operate by. Moreover, when volumes are above average we think its obvious that institutions are active in the market so if the market drops on heavier volume that means that institutions are selling overall and the market is undergoing distribution.
Get a 14 day Trial of our premium 'Platinum' service for just $9.95 and if you subsequently subscribe to any subscription level we will credit your $9.95 to your subscription. 14
Day Platinum Trial |
There were no new features added this week.
One of the most common questions we get concerns subscribers not getting access to the services they subscribed to. In almost all cases, this is because they are not logged into the site, or have become logged out for some reason. This week we will explain how access to the site works.
Getting Logged In
There are two ways for subscribers to login to the site:
- By clicking the
 button
on the home page which will bring up a login form like this:
button
on the home page which will bring up a login form like this: 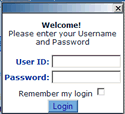 If
you check the 'Remember my login' box you will not have to login using this
login method again as long as you are on the same computer or have not cleared
your cookies.
If
you check the 'Remember my login' box you will not have to login using this
login method again as long as you are on the same computer or have not cleared
your cookies. - By clicking an item on the home page menu bar. If you set your login to be remembered, then you will be logged-in automatically. If your login isn't remembered, then you will be logged in as guest but still taken to your menu choice. Note that logging-in by clicking a menu choice only works from the home page.
To see that you are logged in correctly, look at the blue status bar at the bottom of the page, it will tell you your login status:
![]()
Staying Logged In
Once you are logged in, the site sets up a 'session' for you. As long as your session is active, the site knows who you are and what your subscription level is. The session is kept active by the blue status bar which refreshes every 60 seconds and lets the site know that you are still connected. This works even if you have the browser minimized and are doing other things on your computer. If you close the browser window, or open up another site in the same window, then your session will be deactivated because the blue status bar cannot refresh.
Another function of the blue status bar is that it allows us to send you messages about when the daily site update is starting and has finished. If you don't promptly respond to those messages, the status bar can't refresh and you will be logged out.
You can stay logged in to breakoutwatch and visit other sites by opening another browser window. In tabbed browsers, such as Firefox, this is easy by typing ctrl-T on the keyboard. In IE you need to open a new window from the File menu.
We only allow one session to be active at one time, so if you login from a different computer, or open a new session from a different browser or browser window, your first session will be logged out.
What to do if you are not logged in correctly
Usually the first indication of this is that you are told your subscription level isn't appropriate to the service you are trying to access. Check the blue status bar and it will probably show this:
![]()
In that case you can click the home page link and login again as described above.
If that doesn't work, close your browser and start again.
If it still doesn't work and you tried to login by clicking the menu bar
on the home page, then maybe your 'remember' cookie has been removed or you
changed your password. In that case, click the home page login button and then
click the click here link. 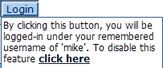 This
will remove the cookie and you can then login by method 1.
This
will remove the cookie and you can then login by method 1.
Get a 14 day Trial of our premium 'Platinum' service for just $9.95 and if you subsequently subscribe to any subscription level we will credit your $9.95 to your subscription. 14
Day Platinum Trial |
| Index | Value | Change Week | Change YTD | Market1 Signal |
||||||||||||||||||||||||||||||||||||
|---|---|---|---|---|---|---|---|---|---|---|---|---|---|---|---|---|---|---|---|---|---|---|---|---|---|---|---|---|---|---|---|---|---|---|---|---|---|---|---|---|
| Dow | 10793.6 | -1.04% | 0.71% | enter | ||||||||||||||||||||||||||||||||||||
| NASDAQ | 2262.58 | -1.81% | 2.6% | exit | ||||||||||||||||||||||||||||||||||||
| S&P 500 | 1264.03 | -1.53% | 1.26% | enter | ||||||||||||||||||||||||||||||||||||
1The Market Signal is derived from our proprietary
market model. The market model is described on the site. 2The site also shows industry rankings based on fundamentals, combined technical and fundamentals, and on price alone (similar to IBD). The site also shows daily industry movements. |
||||||||||||||||||||||||||||||||||||||||
# of Breakouts
|
Period Average1
|
Max. Gain During Period2
|
Gain at Period Close3
|
|
|---|---|---|---|---|
| This Week | 47 | 38.92 | 5.1% | -0.19% |
| Last Week | 76 | 38.46 | 8.25% | 2.9% |
| 13 Weeks | 568 | 41.69 | 15.42% |
7.45% |
Sector
|
Industry
|
Breakout Count for Week
|
|---|---|---|
Oil & Gas
|
Oil & Gas-U S Explr/Prod
|
4
|
Banks
|
Banks-Northeast
|
3
|
Telecomm
|
Telecomm-Equipment
|
3
|
Computer Software
|
Comp Software-Healthcare
|
2
|
Diversified Operations
|
Diversified Operations
|
2
|
Energy
|
Energy-Other Sources
|
2
|
Internet
|
Internet-ISP/Content
|
2
|
Machinery
|
Machinery-Industrial
|
2
|
Retail
|
Retail-Apparel
|
2
|
Retail
|
Retail-Restaurant
|
2
|
Building
|
Building-Heavy Constr
|
1
|
Building
|
Building-Products/Misc
|
1
|
Chemical
|
Chemical-Specialty
|
1
|
Computer Software
|
Comp Software-Enterprise
|
1
|
Finance
|
Finance-Brokers
|
1
|
Finance
|
Finance-Mortgage Services
|
1
|
Food
|
Food-Sugar/Flour/Grain
|
1
|
Food
|
Food-Prepared
|
1
|
Healthcare
|
Healthcare-Instruments
|
1
|
Healthcare
|
Healthcare-HMO
|
1
|
Healthcare
|
Healthcare-Biomed/Genetic
|
1
|
Insurance
|
Insurance-Prop/Casualty/TItl
|
1
|
Leisure
|
Leisure-Services
|
1
|
Machinery
|
Machinery-Farm
|
1
|
Mining
|
Mining-Misc Ores
|
1
|
Oil & Gas
|
Oil & Gas-Refining/Mktg
|
1
|
Pollution Control
|
Pollution Control-Equip
|
1
|
Retail
|
Retail-Department Stores
|
1
|
Special
|
Special-Market/Tracking Funds
|
1
|
Telecomm
|
Telecomm-Services US
|
1
|
Telecomm
|
Telecomm-Wireless Services
|
1
|
Utility
|
Utility-Gas
|
1
|
Utility
|
Utility-Electric
|
1
|
2This represents the return if each stock were bought at its breakout price and sold at its intraday high.
3This represents the return if each stock were bought at its breakout price and sold at the most recent close.
Category |
Symbol |
Company Name |
Expected Gain1 |
|---|---|---|---|
| Best Overall | IMCO | IMPCO TECHNOLOGIES INC | 94 |
| Top Technical | PTA | PENN TREATY AMERN CORP | 57 |
| Top Fundamental | QSII | QUALITY SYS INC | 29 |
| Top Tech. & Fund. | QSII | QUALITY SYS INC | 29 |
Category |
Symbol |
Company Name |
Expected Gain1 |
|---|---|---|---|
| Best Overall | ABP | ABRAXAS PETE CORP | 90 |
| Top Technical | VPHM | VIROPHARMA INC | 61 |
| Top Fundamental | TOMO | TOM Online Inc. | 34 |
| Top Tech. & Fund. | TOMO | TOM Online Inc. | 34 |
If you received this newletter from a friend and you would like to receive it regularly please go to the BreakoutWatch.com site and enter as a Guest. You will then be able to register to receive the newsletter.
Copyright © 2006 NBIcharts, LLC dba BreakoutWatch.com. All rights reserved.