| Market Summary | Weekly Breakout Report | Top Breakout Choices | Top 2nd Chances | New Features | Tip of the Week |
Market Summary
On Tuesday the markets got their wish that the Fed would not raise interest rates, but did not get the clarity regarding the Fed's future intentions that they would have liked. The accompanying statement left open the possibility of further rate rises as "some inflation risks remain". On the same day, the existence of these risks was reinforced by the Labor Department reporting that productivity slowed and labor costs rose in the second quarter. The waters were further muddied by a rare lack of unanimity on the Open Markets Committee, with one Federal Reserve president having voted to raise interest rates again now. Market, economic and geopolitical factors continued to conflict until Friday when all three major indexes closed down for the week with the DJI losing 1.35%, the S&P 500 dipping 0.99% and the NASDAQ Composite dropping 0.99%.
Investors are now hoping that inflation will abate as the economy slows and the Fed will see no reason to raise rates further. They also hope that the as yet unfelt impact of past rate increases, together with the slowing housing market and rising energy costs will not push the economy into recession. This delicate balance has investors in a heightened state of anxiety and we can expect continued volatility as each day brings news that affects the inflationary and economic outlooks. Additionally, we are in the dog-days of August and we are not likely to see any buying strength until September.
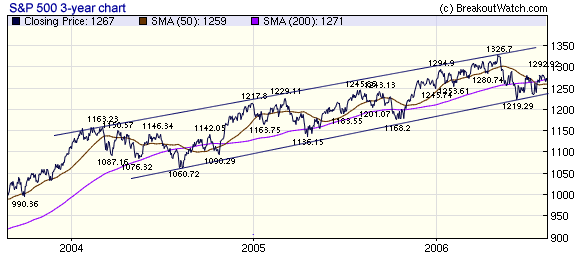
A 3 year chart of the S&P 500 shows that while we experienced a correction between mid-May and mid-June, the rally that began on June 14 is still intact and the index overall is continuing on its long term growth path. Although we still recommend caution, based on our market model for the NASDAQ indicating an exit, a move above 1290 would be bullish while a break below 1240 would break the long term support line and would be very bearish.

The number of breakouts fell to 15 this week but they did sustain an average gain by week's end of 1.44% - a significant improvement over the performance of the major indexes. Two breakouts from cup-with-handle bases made double-digit gains. These were Rent-Way (RWY, gaining 14.64%) which benefited from a take-over offer and Ralcorp Holdings (RAH) which gained 10.44%. Browne & Co. (BNE) broke out of a flat-base and gained 5.71%.
| Get a 14 day Trial of
our premium 'Platinum' service and TradeWatch for just $9.95 and
if you subsequently subscribe to any subscription
level we will credit your $9.95 to your subscription.
14
Day Platinum Trial |
We started sending breakdown alerts based on our Head and Shoulders pattern this week.
Breakdown Day Volume not Significant in Head and Shoulders Breakdowns
Last week we announced that we would send email alerts when stocks on our head and shoulders pattern watchlist fall to their breakdown price and their projected volume is at least equal to their average daily volume. In fact, we did not place a limit on daily volume and sent email alerts as soon as the breakdown price was reached. Why the change? After the announcement, we looked at the volume patterns for a successful H&S breakdown and concluded that the volume was not a significant factor.
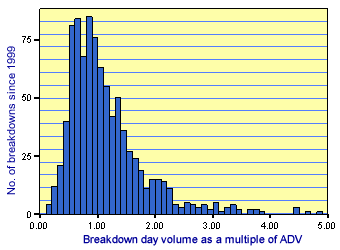
The chart on the right shows a histogram of the number of breakdowns since 1999 against the breakdown day volume as a multiple of average daily volume. It is clear that there are many successful breakdowns when the daily volume is much less than the daily average (the daily average is at 1.0 on the horizontal axis).

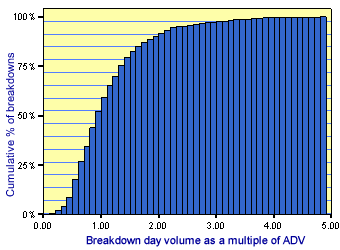
This is very clear in the next chart which shows a cumulative histogram. It is evident that 50% of successful breakdowns occur at less than the average daily daily volume.

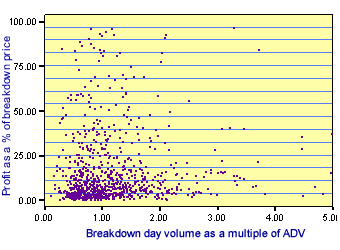
The question then arises as to whether or not the potential profit after breakdown is related to the breakdown day volume. If the potential return was greater on higher breakdown day volume then there would be justification in filtering the alerts by volume. In fact, we see that there is no relationship between potential return and breakdown day volume. The following chart is a scatter plot of the actual potential profit from each breakdown. You can see that substantial returns are possible when the breakdown day volume is well below the average.

We will consider a breakdown from an H&S pattern as confirmed if it closes below the breakdown price at the end of the alert day.
As always, we welcome your comments and suggestions. Please post them to the Breakoutwatch Forum.
Investment Advisors Using our Service
TradeRight Securities, located in a suburb of Chicago, is a full services investment management company and broker/dealer. They have been a subscriber, and user, of BreakoutWatch.com for some time now. They practice CANTATA and use Breakoutwatch.com as a “research analyst”. You can learn more about TradeRight Securities at: www.traderightsecurities.com. If you’re interested in speaking to a representative, simply call them toll-free at 1-800-308-3938 or e-mail gdragel@traderightsecurities.com.
PivotPoint Advisors, LLC takes a technical approach to investment planning and management. A breakoutwatch.com subscriber since May, 2004, they use breakouts, market signals, and now TradeWatch to enhance returns for their clients. Learn more at http://pivotpointadvisors.net or contact John Norquay at 608-826-0840 or by email at john.norquay@pivotpointadvisors.net.
Note to advisors: If you would like to be listed here, please contact us. As a service to those who subscribe to us, there is no additional charge to be listed here.
| Get a 14 day Trial of
our premium 'Platinum' service and TradeWatch for just $9.95 and
if you subsequently subscribe to any subscription
level we will credit your $9.95 to your subscription.
14
Day Platinum Trial |
| Index | Value | Change Week | Change YTD | Market1 Signal |
||||||||||||||||||||||||||||||||||||
|---|---|---|---|---|---|---|---|---|---|---|---|---|---|---|---|---|---|---|---|---|---|---|---|---|---|---|---|---|---|---|---|---|---|---|---|---|---|---|---|---|
| Dow | 11088 | -1.35% | 3.46% | enter | ||||||||||||||||||||||||||||||||||||
| NASDAQ | 2057.71 | -1.31% | -6.69% | exit | ||||||||||||||||||||||||||||||||||||
| S&P 500 | 1266.74 | -0.99% | 1.48% | enter | ||||||||||||||||||||||||||||||||||||
1The Market Signal is derived from our proprietary
market model. The market model is described on the site. 2The site also shows industry rankings based on fundamentals, combined technical and fundamentals, and on price alone (similar to IBD). The site also shows daily industry movements. |
||||||||||||||||||||||||||||||||||||||||
# of Breakouts
|
Period Average1
|
Max. Gain During Period2
|
Gain at Period Close3
|
|
|---|---|---|---|---|
| This Week | 15 | 17.38 | 3.99% | 1.44% |
| Last Week | 42 | 17.23 | 4.44% | 0.31% |
| 13 Weeks | 263 | 18.31 | 7.6% |
-0.48% |
Sector
|
Industry
|
Breakout Count for Week
|
|---|---|---|
Real Estate/ REIT
|
Real Estate-REIT
|
2
|
Special
|
Special-ClsdEndFunds/Bond
|
2
|
Business Services
|
Business Svcs-Printing
|
1
|
Business Services
|
Business Svcs-Misc
|
1
|
Computer Software
|
Comp Software-Security
|
1
|
Diversified Operations
|
Diversified Operations
|
1
|
Finance
|
Finance-Savings&Loan
|
1
|
Food
|
Food-Prepared
|
1
|
Internet
|
Internet-Software
|
1
|
Metal Prds
|
Metal Prds-Pipe/Fab/Misc
|
1
|
Office
|
Office-Supplies
|
1
|
Retail
|
Retail-Home Furnishings
|
1
|
Telecomm
|
Telecomm-Wireless Services
|
1
|
2This represents the return if each stock were bought at its breakout price and sold at its intraday high.
3This represents the return if each stock were bought at its breakout price and sold at the most recent close.
Category |
Symbol |
Company Name |
Expected Gain1 |
|---|---|---|---|
| Best Overall | RICK | Rick's Caberet Intl | 103 |
| Top Technical | RWY | Rent-Way Inc | 55 |
| Top Fundamental | SLB | Schlumberger Ltd | 34 |
| Top Tech. & Fund. | VTS | Veritas Dgc | 40 |
Category |
Symbol |
Company Name |
Expected Gain1 |
|---|---|---|---|
| Best Overall | VRTB | Vestin Realty Mortgage II Inc | 93 |
| Top Technical | VRTB | Vestin Realty Mortgage II Inc | 93 |
| Top Fundamental | TTEC | Teletech Holdings Inc | 64 |
| Top Tech. & Fund. | TTEC | Teletech Holdings Inc | 64 |
If you received this newletter from a friend and you would like to receive it regularly please go to the BreakoutWatch.com site and enter as a Guest. You will then be able to register to receive the newsletter.
Copyright © 2006 NBIcharts, LLC dba BreakoutWatch.com. All rights reserved.
" BreakoutWatch," the BreakoutWatch.com "eye" logo, and the slogan "tomorrow's breakouts today" are service marks of NBIcharts LLC. All other marks are the property of their respective owners, and are used for descriptive purposes only.