| Market Summary | Weekly Breakout Report | Top Breakout Choices | Top 2nd Chances | New Features | Tip of the Week |
Market Summary
Some air came out of the balloon this week as last week's confidence that the Fed would not raise interest rates further and had also engineered a soft landing for the economy dissipated. Falling oil prices also helped lift the markets last week, but that trend reversed this week.
There was less confidence that increases in interest rates are at an end for now following hawkish comments on Tuesday by Chicago Federal Reserve President Michael Moskow who said "The risk of inflation remaining too high is greater than the risk of growth being too low," and "some additional firming of policy may yet be necessary to bring inflation back into the comfort zone within a reasonable period of time". There was some disappointment when Fed Chairman Bernanke failed to provide a countervailing view in a prepared speech on Friday.
Confidence in the 'soft landing' was shaken by two reports showing that the residential property market has cooled almost to freezing point with inventories of used and new homes rising rapidly. Consumer spending, which accounts for 70% of economic activity, was buoyed over the last 4 years by the 'wealth effect' of rising home prices and cash extracted from homes through refinancing. If consumer spending declines then economic activity will drop and so will corporate profits with dire consequences for stock prices.
For the week, the markets consolidated last weeks exceptional gains with a slightly downward move. The DJI slipped 0.86%, the NASDAQ gave up 1.09% and the S&P 500 corrected by 0.55%. However, these slippages came on very light volume. Pullbacks on light volume after strong gains are signs of sanity in the market.
Our market signal remains at exit for the NASDAQ as that market is still 96 points below its 200 day moving average.
The week brought 20 confirmed breakouts, about average for recent weeks. By Friday evening, these had gained an average of 1.57%, comfortably beating the major indexes.
The oil and gas industry's leadership was replaced this week in our technical ranking of industries by the Food and Dairy Products group while the Food and Meat Products group was the most improved in the technical rankings.
| Get a 14 day Trial of
our premium 'Platinum' service and TradeWatch for just $9.95 and
if you subsequently subscribe to any subscription
level we will credit your $9.95 to your subscription.
14
Day Platinum Trial |
This week were adding a new chart pattern - Head and Shoulders Bottom.
To fit this new pattern into our menu structure we're splitting the 'Mine for Candidates' menu into 'Long Positions' and 'Short Positions' as shown below.
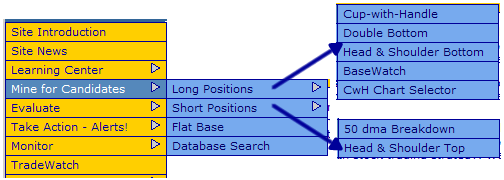
We have also renamed the 'ShortsaleWatch' to '50 dma Breakdown' as it is no longer the only pattern that can be used to find short sale opportunities since we added the Head and Shoulders Top pattern.
The Flat Base pattern is not grouped with the Long or Short position patterns, since a stock may breakout or breakdown from a Flat Base pattern.
Head and Shoulders Bottom Pattern on Beta Test
This week we are pleased to be able to introduce a new chart pattern - the Head and Shoulders Bottom. We are presently only displaying charts of stocks that meet the definition below. We hope to start issuing alerts and reporting on breakouts from this pattern following the Labor Day weekend.
The head and shoulders bottom pattern is recognized as one of the most reliable bullish trend reversal patterns. Bulkowski* reports that 95% of these patterns are successful and make an average gain of 38%. It forms after a downtrend and is characterized by three troughs with the center trough lower than the two adjoining troughs.
We will conduct our own back testing on this pattern and publish results in the near future.
The neckline is a line drawn between the two intraday highs between the peaks. We recognize two types of head and shoulder bottom, depending on the slope of the neckline. We do this so we can recognize a breakout price and issue alerts when this price is met.
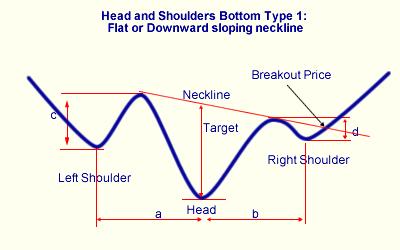
When the neckline is flat or slopes downwards, the breakout price is calculated as the point where the neckline intersects the price line following formation of the right shoulder. It is at this point that the pattern is completed and a long position could be opened (or a short position closed). At this time we can calculate a 'target' increase which is the distance between the center trough's low and the neckline. Bulkowski* estimates this target is reached 83% of the time.
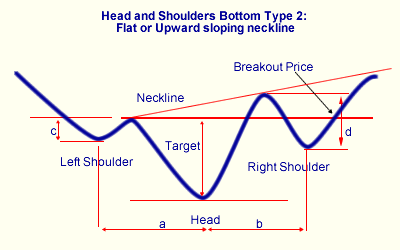
If the neckline slopes up, then it is possible that it will never intersect the price line following the right shoulder, so we use an alternative method of determining a breakout price. In this case we use the support level between the left shoulder and the head and calculate the target price as the difference between that support level and the center trough's low.
Pattern Recognition
Our algorithm will recognize a head and shoulders bottom pattern when the following conditions are met.
- The stock must be in a confirmed up trend before the pattern begins. An uptrend exists if the the left shoulder is at least 30% lower than the high in the previous 6 months (120 trading days).
- The pattern width, shoulder-to-shoulder, must be 6 months (120 trading days) or less.
- The head must have occurred within the last 6 months (120 trading days).
- There must be approximate symmetry to the pattern. We determine this by requiring that number days between the shoulders and the head (a and b in the diagram) must be within 50% of each other.
- There must be a noticeable peak between the left shoulder and the head (c). We chose an arbitrary minimum of 2%. This is measured from the left shoulder intraday low to the intraday low at the left neckline.
- There must be a noticeable peak between the head and the right shoulder (d). We chose an arbitrary minimum of 2%. This is measured from the right shoulder intraday low to the intraday low at the right neckline.
- For downward sloping necklines (Type 1), the breakout price is the the neckline value on the date of the last close.
- For flat or upward sloping necklines (TYpe 2), the breakout price is the value of the intraday low at the left neckline.
- The last close must be below the breakout price.
- The minimum 50 day average volume must be at least 500,000.
- The target % increase must be at least 25%.
Investment Advisors Using our Service
TradeRight Securities, located in a suburb of Chicago, is a full services investment management company and broker/dealer. They have been a subscriber, and user, of BreakoutWatch.com for some time now. They practice CANTATA and use Breakoutwatch.com as a “research analyst”. You can learn more about TradeRight Securities at: www.traderightsecurities.com. If you’re interested in speaking to a representative, simply call them toll-free at 1-800-308-3938 or e-mail gdragel@traderightsecurities.com.
PivotPoint Advisors, LLC takes a technical approach to investment planning and management. A breakoutwatch.com subscriber since May, 2004, they use breakouts, market signals, and now TradeWatch to enhance returns for their clients. Learn more at http://pivotpointadvisors.net or contact John Norquay at 608-826-0840 or by email at john.norquay@pivotpointadvisors.net.
Note to advisors: If you would like to be listed here, please contact us. As a service to those who subscribe to us, there is no additional charge to be listed here.
| Get a 14 day Trial of
our premium 'Platinum' service and TradeWatch for just $9.95 and
if you subsequently subscribe to any subscription
level we will credit your $9.95 to your subscription.
14
Day Platinum Trial |
| Index | Value | Change Week | Change YTD | Market1 Signal |
||||||||||||||||||||||||||||||||||||
|---|---|---|---|---|---|---|---|---|---|---|---|---|---|---|---|---|---|---|---|---|---|---|---|---|---|---|---|---|---|---|---|---|---|---|---|---|---|---|---|---|
| Dow | 11284 | -0.86% | 5.29% | enter | ||||||||||||||||||||||||||||||||||||
| NASDAQ | 2140.29 | -1.09% | -2.95% | exit | ||||||||||||||||||||||||||||||||||||
| S&P 500 | 1295.09 | -0.55% | 3.75% | enter | ||||||||||||||||||||||||||||||||||||
1The Market Signal is derived from our proprietary
market model. The market model is described on the site. 2The site also shows industry rankings based on fundamentals, combined technical and fundamentals, and on price alone (similar to IBD). The site also shows daily industry movements. |
||||||||||||||||||||||||||||||||||||||||
# of Breakouts
|
Period Average1
|
Max. Gain During Period2
|
Gain at Period Close3
|
|
|---|---|---|---|---|
| This Week | 20 | 20.08 | 4.52% | 1.57% |
| Last Week | 31 | 19.31 | 5.1% | 0.52% |
| 13 Weeks | 292 | 20.85 | 8.07% |
0.8% |
Sector
|
Industry
|
Breakout Count for Week
|
|---|---|---|
Oil & Gas
|
Oil & Gas-U S Explr/Prod
|
2
|
Oil & Gas
|
Oil & Gas-Field Services
|
2
|
Telecomm
|
Telecomm-Equipment
|
2
|
Banks
|
Banks-Money Center
|
1
|
Business Services
|
Business Svcs-Sec/Safety
|
1
|
Chemical
|
Chemical-Specialty
|
1
|
Computer
|
Computer-Graphics
|
1
|
Computer Software
|
Comp Software-Security
|
1
|
Healthcare
|
Healthcare-Biomed/Genetic
|
1
|
Leisure
|
Leisure-Photo Prds
|
1
|
Mining
|
Mining-Gold/Silver/Gems
|
1
|
Real Estate/ REIT
|
Real Estate Management
|
1
|
Real Estate/ REIT
|
Real Estate-REIT
|
1
|
Retail
|
Retail-Restaurant
|
1
|
Telecomm
|
Telecomm-Wireless Services
|
1
|
Transportation
|
Transportation-Ship
|
1
|
2This represents the return if each stock were bought at its breakout price and sold at its intraday high.
3This represents the return if each stock were bought at its breakout price and sold at the most recent close.
Category |
Symbol |
Company Name |
Expected Gain1 |
|---|---|---|---|
| Best Overall | HL | Hecla Mining Co | 112 |
| Top Technical | VRTB | Vestin Realty Mortgage II Inc | 103 |
| Top Fundamental | DIOD | Diodes Inc | 48 |
| Top Tech. & Fund. | FORM | Formfactor Inc | 52 |
Category |
Symbol |
Company Name |
Expected Gain1 |
|---|---|---|---|
| Best Overall | TXCO | Exploration Co Of Delawr | 75 |
| Top Technical | CPY | Cpi Corp | 0 |
| Top Fundamental | ARD | Arena Resources Inc | 54 |
| Top Tech. & Fund. | ARD | Arena Resources Inc | 54 |
If you received this newletter from a friend and you would like to receive it regularly please go to the BreakoutWatch.com site and enter as a Guest. You will then be able to register to receive the newsletter.
Copyright © 2006 NBIcharts, LLC dba BreakoutWatch.com. All rights reserved.
" BreakoutWatch," the BreakoutWatch.com "eye" logo, and the slogan "tomorrow's breakouts today" are service marks of NBIcharts LLC. All other marks are the property of their respective owners, and are used for descriptive purposes only.