| Market Summary | Weekly Breakout Report | Top Breakout Choices | Top 2nd Chances | New Features | Tip of the Week |
Market Summary
The NASDAQ Composite experienced three successive distribution days (a lower close on higher volume) this week bringing the count to five within the last three weeks and our market model consequently signaled an 'exit'. The NASDAQ lost a little over 2% for the week but is still the leading index year-to-date. The index was set back by several technology companies exceeding earnings expectations but guiding expectations lower for the coming year. It is no longer 'what have you done for me lately' but 'what will you do for me tomorrow?'. This is why technical factors, which indicate how the market values a company now, are more important than past performance represented in the fundamentals. The other major indexes ended the week little changed with the DJI adding just 0.07% and the S&P 500 slipping 0.02%.
The economic news for the week indicated that the economy is not weakening as quickly as expected. Consumer confidence is climbing due to falling gas prices, rising earnings and lower jobless claims. This is supporting prices and the CPI remained unchanged. Prospects for an early interest rate cut are now almost completely discounted and longer term bond yields have moved higher, although the yield curve remains inverted. The warm weather has helped reduce demand for oil and also supported home construction, which usually declines in cold weather. Some view these short term effects as only postponing the inevitable 'hard-landing' (see Roubini's Blog).
The market action next week will be dominated by earnings reports, which so far have been quite strong, but companies are guiding future expectations lower, so executives seem to have bought into the declining economy scenario. These kinds of forecasts tend to be self-fulfilling, so we can expect stock valuations to soften further. Our market signal is a recognition that this is happening.
However, our market signal is not infallible, as our review in this week's Top Tip shows. It may herald a steep correction as it did on last May 10, and saved our subscribers a bunch of money, or it could be a false alarm which could cause you to exit some positions that will go on to bigger gains. Over the long term it has performed well. There is clearly nervousness in the markets because of the strong gains since last August and the knowledge that the economy is slowing while inflation remains above the Fed's desired range. A pull-back seems more likely than a move upwards.
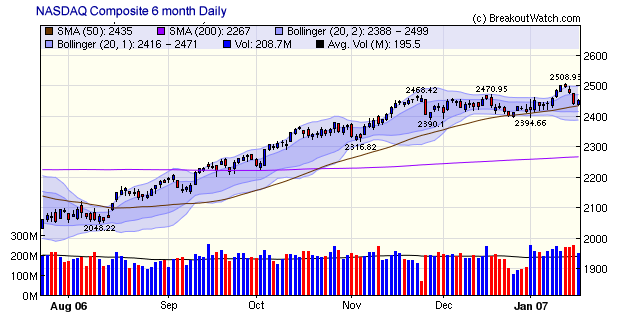
The NASDAQ did find support at the 50 day moving average level on Friday and may recover from here but another test of the 50 day moving average is likely. A break of that support level would be bearish.
| Get a 14 day Trial of our premium 'Platinum'
service and TradeWatch for just $9.95 and if you subsequently subscribe
to any subscription level we will credit your $9.95 to your subscription.
14
Day Platinum Trial |
There were no new features added this week.
This week our market signal for the NASDAQ market reversed to 'exit'. This week we'll explain why and look at how the market signal performed over the last year and the last 5 years.
Market signals are generated by our Market Model based on distribution days and follow through days. A distribution day is one where the index closes down on higher volume than the previous day and follow through day is an accumulation day that occurs within a range of days (see below) after a market bottom. Note that our definition of a distribution day is clear cut and simple. This explains why our distribution day count on the NASDAQ this week climbed to five while a prominent investment daily only has the count at 3.
How the Market Model Works.
Each day after the market closes we look at the market movement for the day and assess whether the current signal should change.
If the current signal is 'enter', then we count the number of distribution days for each of the three major indexes over the last few trading sessions. We will issue an 'exit' signal if the number of distribution days exceeds a threshold as follows:
| Distribution Day Thresholds for Exit Signals | ||
Index |
Distribution Days |
No. Of Sessions |
|---|---|---|
DJI |
7 |
12 |
NASDAQ |
5 |
15 |
S&P 500 |
9 |
18 |
If the current signal is 'Exit', then we look for the day on which the index set its lowest intraday low since the last exit signal was issued and closed above that low. We'll call that 'day 1' of the recovery since it closed above the lowest low. We then look for a follow through day where the index closed at least 1.5% above the close on 'day 1' and volume exceeded the previous day's volume (an accumulation day). That follow through day must occur within a certain minimum and maximum number of days after day 1 as follows:
| Follow Through Day Limits | ||
Index |
Minimum Day No. |
Maximum Day No. |
|---|---|---|
DJI |
4 |
7 |
NASDAQ |
4 |
10 |
S&P 500 |
4 |
9 |
There is also an additional requirement that the close must be at least 0.05% above its 200 day moving average.
There is more information on how we built the model here.
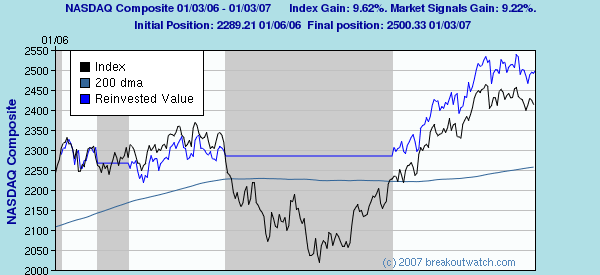
How the Model worked in 2006
The model successfully avoided the large correction that began in May when it issued a sell signal on May 10. However, the requirement that a follow-through day can only occur if the index is above its 200 day moving average, meant that an enter signal was only issued on September 13, well after the market bottom. this significantly reduced the overall return and the model ended up breaking about even. The following chart shows the entry and exit points for 2006 and the returns for the index and the returns achieved if using the enter and exit signals. The 200 dma is also shown so you can see how the enter signal was delayed.
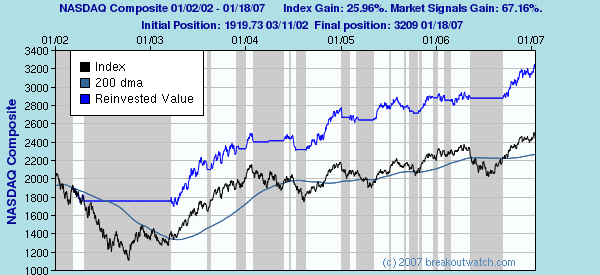
Model Performance Over 5 Years
Over the past five years the model has outperformed the NASDAQ Index by a factor of almost three:
Investment Advisors Using our Service
TradeRight Securities, located in a suburb of Chicago, is a full services investment management company and broker/dealer. They have been a subscriber, and user, of BreakoutWatch.com for some time now. They practice CANTATA and use Breakoutwatch.com as a “research analyst”. You can learn more about TradeRight Securities at: www.traderightsecurities.com. If you’re interested in speaking to a representative, simply call them toll-free at 1-800-308-3938 or e-mail gdragel@traderightsecurities.com.
PivotPoint Advisors, LLC takes a technical approach to investment planning and management. A breakoutwatch.com subscriber since May, 2004, they use breakouts, market signals, and now TradeWatch to enhance returns for their clients. Learn more at http://pivotpointadvisors.net or contact John Norquay at 608-826-0840 or by email at john.norquay@pivotpointadvisors.net.
Note to advisors: If you would like to be listed here, please contact us. As a service to those who subscribe to us, there is no additional charge to be listed here.
| Get a 14 day Trial of
our premium 'Platinum' service and TradeWatch for just $9.95 and
if you subsequently subscribe to any subscription
level we will credit your $9.95 to your subscription.
14
Day Platinum Trial |
| Index | Value | Change Week | Change YTD | Market1 Signal |
||||||||||||||||||||||||||||||||||||
|---|---|---|---|---|---|---|---|---|---|---|---|---|---|---|---|---|---|---|---|---|---|---|---|---|---|---|---|---|---|---|---|---|---|---|---|---|---|---|---|---|
| Dow | 12565.5 | 0.07% | 0.82% | enter | ||||||||||||||||||||||||||||||||||||
| NASDAQ | 2451.31 | -2.06% | 1.49% | exit | ||||||||||||||||||||||||||||||||||||
| S&P 500 | 1430.5 | -0.02% | 0.86% | enter | ||||||||||||||||||||||||||||||||||||
1The Market Signal is derived from our proprietary
market model. The market model is described on the site. 2The site also shows industry rankings based on fundamentals, combined technical and fundamentals, and on price alone (similar to IBD). The site also shows daily industry movements. |
||||||||||||||||||||||||||||||||||||||||
# of Breakouts
|
Period Average1
|
Max. Gain During Period2
|
Gain at Period Close3
|
|
|---|---|---|---|---|
| This Week | 16 | 26.31 | 1.64% | -0.44% |
| Last Week | 39 | 28.46 | 3.19% | -0.26% |
| 13 Weeks | 394 | 29.31 | 12.97% |
4.38% |
Sector
|
Industry
|
Breakout Count for Week
|
|---|---|---|
DRUGS
|
Diagnostic Substances
|
2
|
AUTOMOTIVE
|
Auto Manufacturers - Major
|
1
|
BANKING
|
Money Center Banks
|
1
|
CONGLOMERATES
|
Conglomerates
|
1
|
CONSUMER NON-DURABLES
|
Paper & Paper Products
|
1
|
DIVERSIFIED SERVICES
|
Rental & Leasing Services
|
1
|
DIVERSIFIED SERVICES
|
Security & Protection Services
|
1
|
ELECTRONICS
|
Scientific & Technical Instruments
|
1
|
FINANCIAL SERVICES
|
Asset Management
|
1
|
MANUFACTURING
|
Industrial Electrical Equipment
|
1
|
MANUFACTURING
|
Farm & Construction Machinery
|
1
|
MEDIA
|
Publishing - Newspapers
|
1
|
RETAIL
|
Grocery Stores
|
1
|
RETAIL
|
Department Stores
|
1
|
WHOLESALE
|
Computers Wholesale
|
1
|
2This represents the return if each stock were bought at its breakout price and sold at its intraday high.
3This represents the return if each stock were bought at its breakout price and sold at the most recent close.
Category |
Symbol |
Company Name |
Expected Gain1 |
|---|---|---|---|
| Best Overall | IGTE | Igate Corporaion | 100 |
| Top Technical | PRGX | Prg-schultz Intl Inc | 61 |
| Top Fundamental | INFY | Infosys Technologies Ads | 40 |
| Top Tech. & Fund. | WFR | Memc Electronic Material | 41 |
Category |
Symbol |
Company Name |
Expected Gain1 |
|---|---|---|---|
| Best Overall | SPTN | Spartan Stores Inc | 54 |
| Top Technical | SPTN | Spartan Stores Inc | 54 |
| Top Fundamental | BDC | Belden Inc | 29 |
| Top Tech. & Fund. | BDC | Belden Inc | 29 |
If you received this newletter from a friend and you would like to receive it regularly please go to the BreakoutWatch.com site and enter as a Guest. You will then be able to register to receive the newsletter.
Copyright © 2007 NBIcharts, LLC dba BreakoutWatch.com. All rights reserved.
" BreakoutWatch," the BreakoutWatch.com "eye" logo, and the slogan "tomorrow's breakouts today" are service marks of NBIcharts LLC. All other marks are the property of their respective owners, and are used for descriptive purposes only.