| Market Summary | Weekly Breakout Report | Top Breakout Choices | Top 2nd Chances | New Features | Tip of the Week |
Market Summary
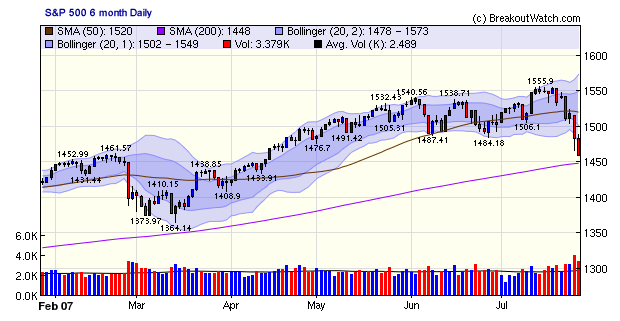
It would be inappropriate to brag about our market signal going to exit last Friday just before the biggest weekly fall in the S&P 500 since September 2002 as it lost 4.9%. As we pointed out last week, the signal has been erratic this year, to say the least, but this time it may finally have got it right. Other indexes did not fall as sharply but the carnage was still pretty bad as the DJI lost 4.23% and the NASDAQ Composite dropped 4.66%. Volumes increased sharply adding strength to the sell-off. Volumes were 70% above average and Thursday and 40% above average on Friday. All three indexes are below their 50 day moving average and the S&P 500 looks as though it will test support at its 200 day moving average in the near future as it is only 10.8 points (0.7%) above that level now.
Each day we publish a snapshot of the market condition in the form of an equivolume chart. The equivolume chart is a succinct summary of price, volume, accumulation day, distribution day action and the relationship to short, medium and longer term moving averages. The equivolume chart of the SPX index as of Friday provides a clear picture of the amount of distribution that has taken place in the last six sessions and how close it is to the 200 dma support line.
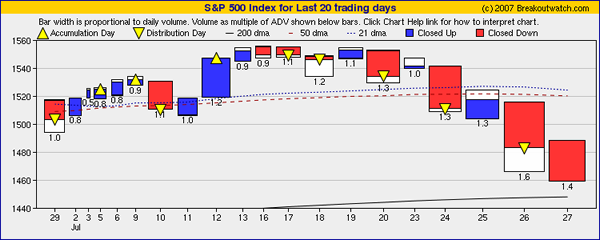
If it fails to find support early next week, then we could see the S&P 500 fall to the level it reached following the China market crash in February, which would be a further 6% below the current level.
While February's correction was in reaction to an intervention by the Chinese government in their local market and was quickly erased, the causes of the current correction are much more systemic and likely to have a longer term influence on markets in the US. Credit is tightening and the cheap and easy money that has fueled the expansion so far is drying up. We can expect the "plunge protection team" to step in and halt the slide, although when remains in question. Inflation is coming under control, as Friday's core CPI number fell to 1.4% in the second quarter so the Fed may feel there is room to expend the money supply further thereby adding more liquidity, and easier credit, to the market.
While the economy exceeded expectations in the second quarter, the credit squeeze will make business investment more expensive and may prolong the housing recession. Prospects for economic growth in the second half of the year are falling and there is now a real possibility that the Fed will cut interest rates later this year.
In the meantime, I recommend being in cash.
Gold members were given access to our T/A charts.
If you did not heed the advice of our market signal last week, then go to cash now. This may be a correction or it may be the begining of the long anticipated bear market. It is too soon to know but unless you are very risk tolerant, this is the time to be on sidelines.
Investment Advisors Using our Service
TradeRight Securities, located in a suburb of Chicago, is a full services investment management company and broker/dealer. They have been a subscriber, and user, of BreakoutWatch.com for some time now. They practice CANTATA and use Breakoutwatch.com as a “research analyst”. You can learn more about TradeRight Securities at: www.traderightsecurities.com. If you’re interested in speaking to a representative, simply call them toll-free at 1-800-308-3938 or e-mail gdragel@traderightsecurities.com.
Note to advisors: If you would like to be listed here, please contact us. As a service to those who subscribe to us, there is no additional charge to be listed here.
| Get a 14 day Trial of
our premium 'Platinum' service and TradeWatch for just $9.95 and
if you subsequently subscribe to any subscription
level we will credit your $9.95 to your subscription.
14
Day Platinum Trial |
| Index | Value | Change Week | Change YTD | Market1 Signal |
||||||||||||||||||||||||||||||||||||
|---|---|---|---|---|---|---|---|---|---|---|---|---|---|---|---|---|---|---|---|---|---|---|---|---|---|---|---|---|---|---|---|---|---|---|---|---|---|---|---|---|
| Dow | 13265.5 | -4.23% | 6.44% | enter | ||||||||||||||||||||||||||||||||||||
| NASDAQ | 2562.24 | -4.66% | 6.08% | exit | ||||||||||||||||||||||||||||||||||||
| S&P 500 | 1458.95 | -4.9% | 2.87% | enter | ||||||||||||||||||||||||||||||||||||
1The Market Signal is derived from our proprietary
market model. The market model is described on the site. 2The site also shows industry rankings based on fundamentals, combined technical and fundamentals, and on price alone (similar to IBD). The site also shows daily industry movements. |
||||||||||||||||||||||||||||||||||||||||
# of Breakouts
|
Period Average1
|
Max. Gain During Period2
|
Gain at Period Close3
|
|
|---|---|---|---|---|
| This Week | 11 | 15.62 | 6.64% | 0.03% |
| Last Week | 23 | 17.69 | 4.34% | -4.56% |
| 13 Weeks | 331 | 18.54 | 9.27% |
-4.52% |
Sector
|
Industry
|
Breakout Count for Week
|
|---|---|---|
FINANCIAL SERVICES
|
Closed-End Fund - Equity
|
4
|
CHEMICALS
|
Agricultural Chemicals
|
1
|
DIVERSIFIED SERVICES
|
Personal Services
|
1
|
DRUGS
|
Drug Manufacturers - Other
|
1
|
ENERGY
|
Oil & Gas Equipment & Services
|
1
|
HEALTH SERVICES
|
Medical Appliances & Equipment
|
1
|
TELECOMMUNICATIONS
|
Processing Systems & Products
|
1
|
TRANSPORTATION
|
Major Airlines
|
1
|
2This represents the return if each stock were bought at its breakout price and sold at its intraday high.
3This represents the return if each stock were bought at its breakout price and sold at the most recent close.
Category |
Symbol |
Company Name |
Expected Gain1 |
|---|---|---|---|
| Best Overall | CUP | Peru Copper Inc | 105 |
| Top Technical | AIXG | Aixtron Aktiengesellschaft Ads | 74 |
| Top Fundamental | LIFC | Lifecell Corporation | 39 |
| Top Tech. & Fund. | VSEA | Varian Semiconductor | 40 |
Category |
Symbol |
Company Name |
Expected Gain1 |
|---|---|---|---|
| Best Overall | CSV | Carriage Services Inc | 83 |
| Top Technical | CSV | Carriage Services Inc | 83 |
| Top Fundamental | WFT | Weatherford International Ltd | 0 |
| Top Tech. & Fund. | WFT | Weatherford International Ltd | 0 |
If you received this newletter from a friend and you would like to receive it regularly please go to the BreakoutWatch.com site and enter as a Guest. You will then be able to register to receive the newsletter.
Copyright © 2007 NBIcharts, LLC dba BreakoutWatch.com. All rights reserved.
" BreakoutWatch," the BreakoutWatch.com "eye" logo, and the slogan "tomorrow's breakouts today" are service marks of NBIcharts LLC. All other marks are the property of their respective owners, and are used for descriptive purposes only.