| Market Summary | Weekly Breakout Report | Top Breakout Choices | Top 2nd Chances | New Features | Tip of the Week |
Market Summary
Weakness in employment sent a scare through the markets on Friday after there had been encouraging news earlier in the week, from the Beige Book and the ISM non-manufacturing index, that the economy was weathering the credit squeeze stemming from the sub-prime loan and housing debacles. While the consumer might have been willing to continue to spend on their credit cards while employment remained high, the prospect of job losses will certainly curtail spending if unemployment rises. Job losses have already occurred in the construction and mortgage businesses and after the market closed on Friday, Countrywide Mortgage announced it may cut 10,000-12,000 jobs in the next three months depending on the interest rate climate.
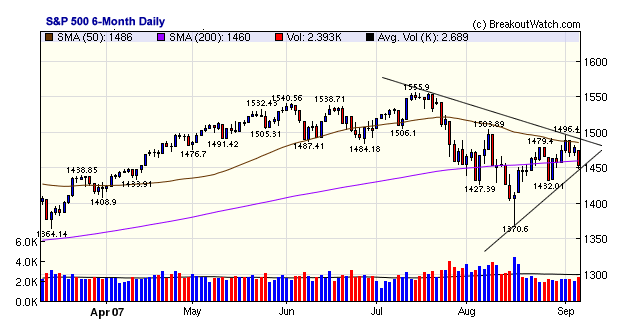
For the week, the DJI lost 1.83%, the NASDAQ Composite 1.18% and the S&P 500 1.39%. The rally that began on August 18 remains intact, but as the chart of the S&P 500 below shows, it is again in jeopardy as the SPX closed below its 200 day moving average for the fourth time since the beginning of August. Note also that the 50 dma represents a resistance line and that line has been falling since late July. A cut in interest rates is expected but the markets may be disappointed if the cut is only 0.25%. I would expect a brief rally if a 0.25% cut is announced in the next few days, but I would not expect the index to hold above the 50 dma unless there is a bigger cut. If there is no interest rate cut before the September 18 FOMC meeting, then we can expect the SPX to test resistance at 1432 and possibly 1410. I would expect that PPT intervention would prevent a test of the 1370 low of August 18, but if Alan Greenspan is right and this crisis looks a lot like 1987, then who knows where the floor might be.
While the Fed Futures market is betting that there is a 72% chance that there will be a 0.5% rate cut soon, we have seen the futures market be wrong about interest rates several times in the last 12 months, starting with the inversion of the yield curve in 2006 that was supposed to foretell a recession. On Thursday, four Federal Reserve Presidents said they hadn't yet seen evidence that a rate cut is necessary, but Friday's unemployment data may change their mind. Goldman Sachs increased its rate cut prediction to 0.5% from 0.25%.
With so much central bank intervention here and in Europe, and with the PPT likely to be very active, it is even more difficult than usual to predict the market direction. Neither technical nor fundamental indicators can be relied upon so gut feel is all we have to go on. On balance, I still believe the Administration and Federal Reserve will do whatever is necessary to avoid a market collapse and that the rally will continue but volatility will remain high.
No new features this week.
Comparison of Successful Alerts to Alerts Issued
I was asked by a subscriber to provide an analysis of the number of alerts that are 'successful' compared to the number of email alerts issued, so here it is.
The 'Buy Alerts' are issued intra-day and are issued when the stock has risen to its breakout (pivot) price and the projected volume for the day will be at least 1.5 times the average volume. An alert is considered a success if it closes at or over its pivot price and the actual volume met or exceeded 1.5 times the average.
The 'Short Alerts' are issued intra-day when the the support or target price is met and the volume projection will be at least 1.5 times average, except for Head & Shoulders Top alerts which are issued on price alone without consideration of volume (see this newsletter).
You will see that both types of alert can be issued for the Flat Base patterns. This is because a Flat Base occurs when a stock has paused in its rise or fall and can then either break above resistance or fall below support.
The success rate of the short alerts from the Flat Bottom patterns is something we were not aware of. We'll investigate this further next week.
| Watchlist | Total* | Alerts | BO | Success % | |
|---|---|---|---|---|---|
| Buy Alerts | |||||
| Cup-with-Handle | 186608 | 9565 | 4297 | 44.9% | |
| Double Bottom | 13504 | 476 | 173 | 36.3% | |
| Flat Base Top | 24199 | 1166 | 361 | 31.0% | |
| Flat Base Bottom | 10108 | 392 | 134 | 34.2% | |
| Head & Shoulders Bottom | No data available | ||||
| Short Alerts | |||||
| ShortSale Watch | 20849 | 3471 | 702 | 20.2% | |
| Flat Base Top | 24199 | 764 | 761 | 99.6% | |
| Flat Base Bottom | 10108 | 378 | 376 | 99.5% | |
| Head & Shoulders Top | 6635 | 565 | 321 | 56.8% | |
| * Total is the total number of times we listed a symbol on the watchlist. Because a symbol can appear for several days in succession before a breakout occurs, this is not a particularly meaningful number in itself. | |||||
Investment Advisors Using our Service
TradeRight Securities, located in a suburb of Chicago, is a full services investment management company and broker/dealer. They have been a subscriber, and user, of BreakoutWatch.com for some time now. They practice CANTATA and use Breakoutwatch.com as a “research analyst”. You can learn more about TradeRight Securities at: www.traderightsecurities.com. If you’re interested in speaking to a representative, simply call them toll-free at 1-800-308-3938 or e-mail gdragel@traderightsecurities.com.
Note to advisors: If you would like to be listed here, please contact us. As a service to those who subscribe to us, there is no additional charge to be listed here.
| Get a 14 day Trial of
our premium 'Platinum' service and TradeWatch for just $9.95 and
if you subsequently subscribe to any subscription
level we will credit your $9.95 to your subscription.
14
Day Platinum Trial |
| Index | Value | Change Week | Change YTD | Market1 Signal |
||||||||||||||||||||||||||||||||||||
|---|---|---|---|---|---|---|---|---|---|---|---|---|---|---|---|---|---|---|---|---|---|---|---|---|---|---|---|---|---|---|---|---|---|---|---|---|---|---|---|---|
| Dow | 13113.4 | -1.83% | 5.22% | enter | ||||||||||||||||||||||||||||||||||||
| NASDAQ | 2565.7 | -1.18% | 6.23% | enter | ||||||||||||||||||||||||||||||||||||
| S&P 500 | 1453.55 | -1.39% | 2.49% | enter | ||||||||||||||||||||||||||||||||||||
1The Market Signal is derived from our proprietary
market model. The market model is described on the site. 2The site also shows industry rankings based on fundamentals, combined technical and fundamentals, and on price alone (similar to IBD). The site also shows daily industry movements. |
||||||||||||||||||||||||||||||||||||||||
# of Breakouts
|
Period Average1
|
Max. Gain During Period2
|
Gain at Period Close3
|
|
|---|---|---|---|---|
| This Week | 7 | 11.23 | 3.7% | -0.38% |
| Last Week | 6 | 11.62 | 12.98% | 6.25% |
| 13 Weeks | 231 | 12.15 | 8.86% |
-3.08% |
Sector
|
Industry
|
Breakout Count for Week
|
|---|---|---|
AEROSPACE/DEFENSE
|
Aerospace/Defense Products & Services
|
1
|
COMPUTER HARDWARE
|
Networking & Communication Devices
|
1
|
CONSUMER DURABLES
|
Appliances
|
1
|
DRUGS
|
Biotechnology
|
1
|
ELECTRONICS
|
Printed Circuit Boards
|
1
|
FINANCIAL SERVICES
|
Closed-End Fund - Debt
|
1
|
MEDIA
|
Marketing Services
|
1
|
2This represents the return if each stock were bought at its breakout price and sold at its intraday high.
3This represents the return if each stock were bought at its breakout price and sold at the most recent close.
Category |
Symbol |
Company Name |
Expected Gain1 |
|---|---|---|---|
| Best Overall | ALLI | Allion Healthcare Inc | 104 |
| Top Technical | CFSG | 80 | |
| Top Fundamental | ACTU | Actuate Corporation | 91 |
| Top Tech. & Fund. | SILC | Silicom Ltd | 53 |
Category |
Symbol |
Company Name |
Expected Gain1 |
|---|---|---|---|
| Best Overall | IDP | Idera Pharmaceuticals Inc | 74 |
| Top Technical | CHNR | ChinaNatural Resources | 73 |
| Top Fundamental | DCO | Ducommun Inc | 36 |
| Top Tech. & Fund. | DCO | Ducommun Inc | 36 |
If you received this newletter from a friend and you would like to receive it regularly please go to the BreakoutWatch.com site and enter as a Guest. You will then be able to register to receive the newsletter.
Copyright © 2007 NBIcharts, LLC dba BreakoutWatch.com. All rights reserved.
" BreakoutWatch," the BreakoutWatch.com "eye" logo, and the slogan "tomorrow's breakouts today" are service marks of NBIcharts LLC. All other marks are the property of their respective owners, and are used for descriptive purposes only.