| Market Summary | Weekly Breakout Report | Top Breakout Choices | Top 2nd Chances | New Features | Tip of the Week |
Market Summary
Market conditions altered in favor of growth and technology stocks this week as interest rates fell and the cost of investment and money borrowed for acquisitions declined accordingly. This is good news for our subscribers as our methods favor growth and technology stocks.
The Federal Reserve sent a strong signal to the markets that they will "act as needed to foster price stability and sustainable economic growth" by cutting the prime interest rate by 0.5% when a cut of only 0.25% was expected. They reinforced that signal with another 0.5% cut in the discount rate. Market reaction was euphoric with the biggest 1 day gain in share prices in four years on Tuesday. The rally continued on Wednesday and profit taking did not occur until Thursday on much lighter volume. The markets closed the week with another gain on Friday for an overall gain of 2.81% by the DJI, 2.65% by the NASDAQ Composite and 2.80 % by the S&P 500.
The cut in interest rates also helps those with adjustable rate mortgages as they will now adjust upwards to a lesser extent and so foreclosures may be less severe than previously thought. On the negative side, the cut in interest rates risks stoking inflation as the dollar slides further making imports, especially oil, more expensive. Clearly, the FOMC weighed the risks of inflation against the risks of recession and chose inflation as the lesser of two evils.
Tuesday's gains on strong volume represented a breakout from a cup with handle pattern for the NASDAQ and another new pivot was set on Wednesday.
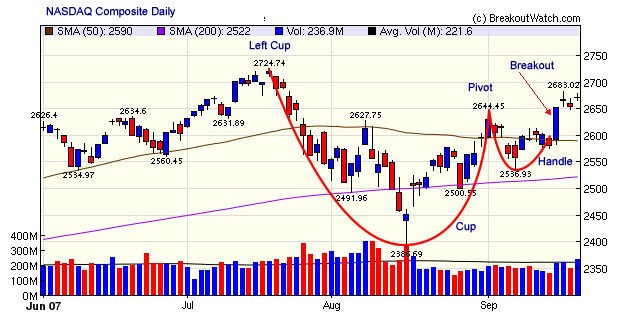
Friday's volume was above the recent average because Friday was a 'quadruple witching' day and also the day on which components of the S&P 500 were rebalanced.
The number of breakouts shot up to 29 this week with an average gain by the close of 4.4%, once again comfortably beating the major indexes. Those subscribers who jumped on ASTI when we issued an alert on Tuesday morning realized a 61% gain by Friday's close.
Each week we publish a list of what we call 'second chances' which are stocks that broke out during the week but are still within a buyable range. In response to an enquiry from a subscriber, we publish an analysis of the performance of these stocks in this week's 'Top Tip'.
Important note to Newsletter Subscribers who are not yet full subscribers: Our 14 day Trial is now completely free - no credit card needed to sign-up.
No new features this week.
Performance of 'Second Chance' stocks
Each week in our newsletter we publish a list of four 'second chance' stocks. These are stocks that broke out during the week from our cup-with-handle watchlist, but are still within 'buyable range' . To qualify the stocks must be between -8% and +5% of their breakout price. The four stocks we select are those that are within this price range and have the best expected gain, best CE score, best technical score and best fundamental score. Following a request from a subscriber, we have analysed the potential results that would be obtained if you bought each of these stocks at the open on the next session after newletter publication and held them for 12 months at the most.
Methodology
The methodology we used is similar to that which is used for our 'Performance Report' of all breakout stocks. We assumed that each stock was bought at the open of the next session. We then tracked each day's high and low price for the next 12 months.
-
We determined which stocks met the newsletter 'second chance' criteria back to the beginning of 2004 and then used the open price at the next session as the 'buy' price.
-
If the stock rose to 5% or more above the buy price, the trade was considered a 'success' and the subsequent highest price achieved was used to calculate the profit on the trade
-
If the stock failed to reach 5% and fell back to 8% or more below the buy price, then the trade was considered a fail and the loss was calculated as 8%
-
if the stock remained within the -8% and +5% range, then it was considered to be still 'in-range' and the highest price achieved was used to calculate the profit.
- An overall return was calculated including the 8% stop losses.
The results were as follows.
| Category | Second Chances | Successes | Fails | In Range | Avg. Success Profit | Avg. In Range Profit | Loss each Failed Trade | Avg Profit All Trades |
|---|---|---|---|---|---|---|---|---|
| Exp Gain | 190 | 137 | 26 | 27 | 48.7% | 2.16% | 8% | 35.43% |
| CE | 190 | 77 | 94 | 19 | 50.38% | 2.27% | 8% | 20.68% |
| CET | 190 | 107 | 61 | 22 | 51.79% | 2.39% | 8% | 29.47% |
| CEF | 190 | 76 | 97 | 17 | 49.55% | 2.45% | 8% | 20.08% |
As can be seen, the most successes and the least fails were for second chances that had the top expected gain value each week. This is as we would expect because our 'Expected Gain' calculation is designed to give the highest score to those stocks with characteristics that we have determined are most likely to give the best return within 12 months. These stocks also gave the best return overall. The second best scoring stocks were those that had the best CET score each week. This also doesn't surprise us because we have always thought that the technicals of a stock were a better indicator of its likely performance after breakout than the fundamentals.
Investment Advisors Using our Service
TradeRight Securities, located in a suburb of Chicago, is a full services investment management company and broker/dealer. They have been a subscriber, and user, of BreakoutWatch.com for some time now. They practice CANTATA and use Breakoutwatch.com as a “research analyst”. You can learn more about TradeRight Securities at: www.traderightsecurities.com. If you’re interested in speaking to a representative, simply call them toll-free at 1-800-308-3938 or e-mail gdragel@traderightsecurities.com.
Note to advisors: If you would like to be listed here, please contact us. As a service to those who subscribe to us, there is no additional charge to be listed here.
Get a 14 day free
Trial of our premium 'Platinum' service and TradeWatch.
No Credit Card Required.
Click
Here for 14 Day Free Trial |
| Index | Value | Change Week | Change YTD | Market1 Signal |
||||||||||||||||||||||||||||||||||||
|---|---|---|---|---|---|---|---|---|---|---|---|---|---|---|---|---|---|---|---|---|---|---|---|---|---|---|---|---|---|---|---|---|---|---|---|---|---|---|---|---|
| Dow | 13820.2 | 2.81% | 10.89% | enter | ||||||||||||||||||||||||||||||||||||
| NASDAQ | 2671.22 | 2.65% | 10.6% | enter | ||||||||||||||||||||||||||||||||||||
| S&P 500 | 1525.75 | 2.8% | 7.58% | enter | ||||||||||||||||||||||||||||||||||||
1The Market Signal is derived from our proprietary
market model. The market model is described on the site. 2The site also shows industry rankings based on fundamentals, combined technical and fundamentals, and on price alone (similar to IBD). The site also shows daily industry movements. |
||||||||||||||||||||||||||||||||||||||||
# of Breakouts
|
Period Average1
|
Max. Gain During Period2
|
Gain at Period Close3
|
|
|---|---|---|---|---|
| This Week | 28 | 11.77 | 8.17% | 4.37% |
| Last Week | 9 | 10.15 | 13.34% | 3.91% |
| 13 Weeks | 227 | 12.31 | 9.55% |
0.62% |
Sector
|
Industry
|
Breakout Count for Week
|
|---|---|---|
CHEMICALS
|
Synthetics
|
2
|
DRUGS
|
Biotechnology
|
2
|
ELECTRONICS
|
Semiconductor Equipment & Materials
|
2
|
ELECTRONICS
|
Semiconductor - Specialized
|
2
|
TELECOMMUNICATIONS
|
Telecom Services - Foreign
|
2
|
BANKING
|
Savings & Loans
|
1
|
COMPUTER SOFTWARE & SERVICES
|
Information Technology
|
1
|
COMPUTER SOFTWARE & SERVICES
|
Business Software & Services
|
1
|
CONSUMER DURABLES
|
Electronic Equipment
|
1
|
DIVERSIFIED SERVICES
|
Research Services
|
1
|
DIVERSIFIED SERVICES
|
Business Services
|
1
|
ELECTRONICS
|
Printed Circuit Boards
|
1
|
ELECTRONICS
|
Semiconductor - Integrated Circuits
|
1
|
ENERGY
|
Oil & Gas Pipelines
|
1
|
FINANCIAL SERVICES
|
Closed-End Fund - Foreign
|
1
|
FINANCIAL SERVICES
|
Diversified Investments
|
1
|
HEALTH SERVICES
|
Medical Appliances & Equipment
|
1
|
INSURANCE
|
Insurance Brokers
|
1
|
MANUFACTURING
|
Industrial Equipment & Components
|
1
|
METALS & MINING
|
Industrial Metals & Minerals
|
1
|
RETAIL
|
Electronics Stores
|
1
|
TELECOMMUNICATIONS
|
Telecom Services - Domestic
|
1
|
TELECOMMUNICATIONS
|
Communication Equipment
|
1
|
2This represents the return if each stock were bought at its breakout price and sold at its intraday high.
3This represents the return if each stock were bought at its breakout price and sold at the most recent close.
Category |
Symbol |
Company Name |
Expected Gain1 |
|---|---|---|---|
| Best Overall | MEA | Metalico Inc | 103 |
| Top Technical | BWTR | Basin Water Inc | 54 |
| Top Fundamental | NBG | National Bk Greece Ads | 70 |
| Top Tech. & Fund. | KMGB | Kmg Chemicals Inc. | 60 |
Category |
Symbol |
Company Name |
Expected Gain1 |
|---|---|---|---|
| Best Overall | GMST | Gemstar-tv Guide Intl | 91 |
| Top Technical | HNSN | Hansen Medical Inc | 33 |
| Top Fundamental | LIFC | Lifecell Corporation | 42 |
| Top Tech. & Fund. | LIFC | Lifecell Corporation | 42 |
If you received this newletter from a friend and you would like to receive it regularly please go to the BreakoutWatch.com site and enter as a Guest. You will then be able to register to receive the newsletter.
Copyright © 2007 NBIcharts, LLC dba BreakoutWatch.com. All rights reserved.
" BreakoutWatch," the BreakoutWatch.com "eye" logo, and the slogan "tomorrow's breakouts today" are service marks of NBIcharts LLC. All other marks are the property of their respective owners, and are used for descriptive purposes only.