| Market Summary | Weekly Breakout Report | Top Breakout Choices | Top 2nd Chances | New Features | Tip of the Week |
Market Summary
S&P 500 Market Signal Goes to Exit
DJI and NASDAQ Market Signals Return to 'Enter'
The headline above shows just how difficult the current trading environment has become. Trading risks are increasing as the day-to-day gyrations of the market testify and the VIX rose on Friday to levels not seen since the Fed first cut the interest rate on September 18. We have been predicting for several weeks that the NASDAQ would outperform the other indexes and it did so again this week gaining 0.22% while the S&P 500 lost 1.67% and the DJI gave up 1.53%. With the Financial and Housing sectors continuing to deteriorate, and with the real truth about losses in the large Banks and brokerage houses still to emerge, we expect the DJI and S&P 500 to continue to be under pressure and eventually this will spread to the NASDAQ also as the economy moves into recession, although when and if that will be officially declared is open to doubt. What is not in doubt is that the numbers we are being fed by the administration and financial institutions are misleading if not fraudulent.
Here are some examples of misleading data:
- The markets rejoiced about the interest rate cut on Wednesday, and even more so about the GDP numbers that exceeded expectations, but the GDP numbers are suspect for a number of reasons. Barry Ritholz estimates that the real GDP growth is already negative. read Shenanigans! for his comments.
- Friday's employment numbers showed a surprising increase in the number of jobs created but the Household Survey showed a loss of 250,000 jobs. Nouriel Roubini takes a look at this dichotomy in his Friday blog.
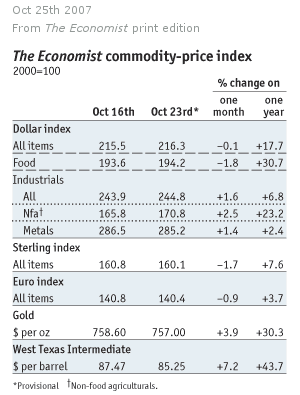
- The GDP number was obtained by using a price deflator (inflation rate) of just 0.8% but how can we possibly believe that number when the most expensive items (food, energy, housing) are excluded and our personal experience says otherwise? Look at the following chart from the Economist which shows commodity price inflation for the last 12 months.

Meanwhile the good times roll, at least for tech. stocks. Those who have reported third quarter earnings are averaging increases of 15% . In comparison, S&P 500 average earnings are negative and well below estimates:
"As of Friday, November 2nd: 388 companies in the S&P 500 have reported earnings for third-quarter, 65% have beaten estimates, 13% were in-line, and 22% have missed. The blended earnings growth rate for the S&P 500 in third-quarter 2007, combining actual numbers for companies that have reported, and estimates for companies yet to report, fell to -1.6%, below the 3.6% estimate from October 1st. On July 1st, the estimated growth rate was 6.2%. (Data provided by Thomson Financial)"
We can expect more bad news from the financial sector in the weeks ahead which will continue to weigh on the S&P 500 in particular . This could come as soon as Monday following an emergency meeting of Citigroup's directors over the weekend where more write downs may be taken and their CEO may stand down.
No new features this week.
Head & Shoulders Bottom Performance
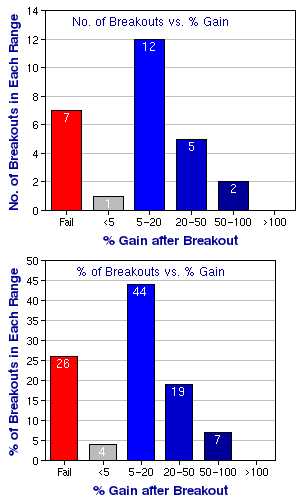
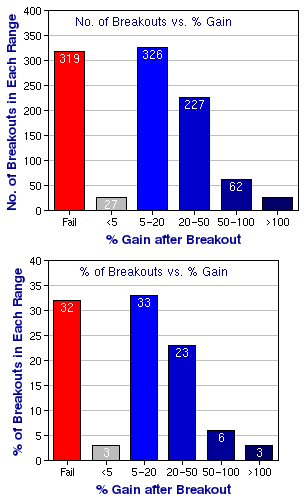
This week, a subscriber asked me if we had performance data for the head and shoulders bottom pattern. We do, although we have not had time to integrate it with our performance reporting system. So this week we present the data for the year-to-date. We hope to add this to our regular performance reporting in the near future. The data below was derived by the same method as for the cup-with-handle breakouts. For comparison purposes, the results for the CwH pattern are presented also.
| Performance | H&S Bottom |
CwH |
|---|---|---|
No. of Breakouts: |
27 | 582 |
%. of Breakouts Exceeding 5% Return: |
63 % |
64 % |
Average Return (incl. 8% stop losses): |
20 % |
33 % |
Average days to maximum gain: |
85 |
100 |
Annualized rate
of return (incl. failures): |
86 % |
120 % |
| Frequency Distribution of Breakout Performance | |
|---|---|
| H&S Bottom |
CwH |
 |
 |
The data above was obtained is follows:
1. A 'breakout' occurs when a stock that is on our watchlist closes above the required minimum breakout price and volume. It is only included in the performance report if it traded within 5% of the breakout price so stocks that gap up and are not within this range are excluded. This is to avoid biasing the results towards breakouts with higher returns that would have been difficult to purchase.
2. Price movements are followed at the close of that and each subsequent day for up to 12 months after breakout.
3. If the stock rises to 5% or more above the breakout price, the subsequent highest price achieved is used to place the stock in one of the % gain after breakout categories shown.
4. If the stock fails to reach 5% and then falls back to 8% or more below the breakout price, then the stock is counted in the 'fail' group and its subsequent performance ignored, unless it forms another CwH and breaks out again when it is treated as a separate breakout event.
5. Stocks that remain within the -8% to +5% range are still 'in-range' and counted in the <5% group.
Investment Advisors Using our Service
TradeRight Securities, located in a suburb of Chicago, is a full services investment management company and broker/dealer. They have been a subscriber, and user, of BreakoutWatch.com for some time now. They practice CANTATA and use Breakoutwatch.com as a “research analyst”. You can learn more about TradeRight Securities at: www.traderightsecurities.com. If you’re interested in speaking to a representative, simply call them toll-free at 1-800-308-3938 or e-mail gdragel@traderightsecurities.com.
Note to advisors: If you would like to be listed here, please contact us. As a service to those who subscribe to us, there is no additional charge to be listed here.
Get a 14 day free
Trial of our premium 'Platinum' service and TradeWatch.
No Credit Card Required.
Click
Here for 14 Day Free Trial |
| Index | Value | Change Week | Change YTD | Market1 Signal |
||||||||||||||||||||||||||||||||||||
|---|---|---|---|---|---|---|---|---|---|---|---|---|---|---|---|---|---|---|---|---|---|---|---|---|---|---|---|---|---|---|---|---|---|---|---|---|---|---|---|---|
| Dow | 13595.1 | -1.53% | 9.08% | enter | ||||||||||||||||||||||||||||||||||||
| NASDAQ | 2810.38 | 0.22% | 16.36% | enter | ||||||||||||||||||||||||||||||||||||
| S&P 500 | 1509.65 | -1.67% | 6.44% | exit | ||||||||||||||||||||||||||||||||||||
1The Market Signal is derived from our proprietary
market model. The market model is described on the site. 2The site also shows industry rankings based on fundamentals, combined technical and fundamentals, and on price alone (similar to IBD). The site also shows daily industry movements. |
||||||||||||||||||||||||||||||||||||||||
# of Breakouts
|
Period Average1
|
Max. Gain During Period2
|
Gain at Period Close3
|
|
|---|---|---|---|---|
| This Week | 25 | 15.69 | 6.34% | 2.53% |
| Last Week | 24 | 14.31 | 9.29% | 2.79% |
| 13 Weeks | 210 | 16.23 | 19.64% |
7.26% |
Sector
|
Industry
|
Breakout Count for Week
|
|---|---|---|
AEROSPACE/DEFENSE
|
Aerospace/Defense Products & Services
|
2
|
ENERGY
|
Oil & Gas Drilling & Exploration
|
2
|
ENERGY
|
Independent Oil & Gas
|
2
|
HEALTH SERVICES
|
Medical Appliances & Equipment
|
2
|
MATERIALS & CONSTRUCTION
|
Heavy Construction
|
2
|
TELECOMMUNICATIONS
|
Communication Equipment
|
2
|
AUTOMOTIVE
|
Auto Parts
|
1
|
COMPUTER SOFTWARE & SERVICES
|
Business Software & Services
|
1
|
DIVERSIFIED SERVICES
|
Business Services
|
1
|
DRUGS
|
Drug Manufacturers - Major
|
1
|
ENERGY
|
Oil & Gas Pipelines
|
1
|
ENERGY
|
Oil & Gas Equipment & Services
|
1
|
FOOD & BEVERAGE
|
Farm Products
|
1
|
HEALTH SERVICES
|
Home Health Care
|
1
|
INSURANCE
|
Insurance Brokers
|
1
|
LEISURE
|
Restaurants
|
1
|
MANUFACTURING
|
Diversified Machinery
|
1
|
REAL ESTATE
|
REIT - Diversified
|
1
|
TELECOMMUNICATIONS
|
Wireless Communications
|
1
|
2This represents the return if each stock were bought at its breakout price and sold at its intraday high.
3This represents the return if each stock were bought at its breakout price and sold at the most recent close.
Category |
Symbol |
Company Name |
Expected Gain1 |
|---|---|---|---|
| Best Overall | EGO | El Dorado Gold Corp | 112 |
| Top Technical | DAR | Darling International | 72 |
| Top Fundamental | EV | Eaton Vance Corp | 41 |
| Top Tech. & Fund. | AOB | American Oriental Bioengineering Inc | 65 |
Category |
Symbol |
Company Name |
Expected Gain1 |
|---|---|---|---|
| Best Overall | ARGN | Amerigon Inc | 73 |
| Top Technical | JDAS | Jda Software Group Inc | 51 |
| Top Fundamental | AOB | American Oriental Bioengineering Inc | 70 |
| Top Tech. & Fund. | AOB | American Oriental Bioengineering Inc | 70 |
If you received this newletter from a friend and you would like to receive it regularly please go to the BreakoutWatch.com site and enter as a Guest. You will then be able to register to receive the newsletter.
Copyright © 2007 NBIcharts, LLC dba BreakoutWatch.com. All rights reserved.
" BreakoutWatch," the BreakoutWatch.com "eye" logo, and the slogan "tomorrow's breakouts today" are service marks of NBIcharts LLC. All other marks are the property of their respective owners, and are used for descriptive purposes only.