| Market Summary | Weekly Breakout Report | Top Breakout Choices | Top 2nd Chances | New Features | Tip of the Week |
Market Summary
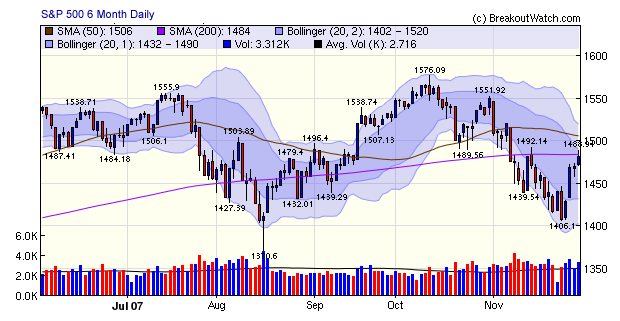
Although the markets made strong gains in the last four days, the S&P 500 met resistance at its 200 day average level on Friday. Had the index sustained itself above the 200 dma level, our market model would have given the green light to enter the markets again as the other requirements (an accumulation day at least four days into the rally, and a close at least 1.5% above the bottom) were met.
 Friday's market action is illuminating because the trend throughtout the day, after an early bounce, was downward. The bounce was a response to statements by Fed Chairman Bernanke that implied further interest rate cuts to come, and news that Treasury Secretary Paulson was organizing the major banks to freeze the resetting of ARMs. The trend lower implied profit taking with the implicit recognition that the early morning levels were unsustainable.
A look at the six-month S&P 500 chart shows that rallies to the 200 dma level have failed twice so far this month so we are waiting for a breakthrough of that level before being convinced that this rally is sustainable.
There were just 8 successful breakouts this week as stocks must struggle back to within range of their pivot levels before a breakout can occur. If the current rally is sustained, then we can expect more successful breakouts to come.
No new features this week.
Some subscribers have expressed interest in our Unilateral Pairs Trading Tool (see the support forum) but time constraints have prevented us from developing this further and the correlations and volatilities had not been updated since the tool was first made available in August.
The correlations and volatilities have now been updated and we will continue to maintain that data each weekend as part of our weekly data revisions.
Investment Advisors Using our Service
TradeRight Securities, located in a suburb of Chicago, is a full services investment management company and broker/dealer. They have been a subscriber, and user, of BreakoutWatch.com for some time now. They practice CANTATA and use Breakoutwatch.com as a “research analyst”. You can learn more about TradeRight Securities at: www.traderightsecurities.com. If you’re interested in speaking to a representative, simply call them toll-free at 1-800-308-3938 or e-mail gdragel@traderightsecurities.com.
Note to advisors: If you would like to be listed here, please contact us. As a service to those who subscribe to us, there is no additional charge to be listed here.
Get a 14 day free
Trial of our premium 'Platinum' service and TradeWatch.
No Credit Card Required.
Click
Here for 14 Day Free Trial |
| Index | Value | Change Week | Change YTD | Market1 Signal |
||||||||||||||||||||||||||||||||||||
|---|---|---|---|---|---|---|---|---|---|---|---|---|---|---|---|---|---|---|---|---|---|---|---|---|---|---|---|---|---|---|---|---|---|---|---|---|---|---|---|---|
| Dow | 12958.4 | -0.17% | 3.97% | enter | ||||||||||||||||||||||||||||||||||||
| NASDAQ | 2580.8 | -0.61% | 6.85% | enter | ||||||||||||||||||||||||||||||||||||
| S&P 500 | 1428.23 | -0.87% | 0.7% | exit | ||||||||||||||||||||||||||||||||||||
1The Market Signal is derived from our proprietary
market model. The market model is described on the site. 2The site also shows industry rankings based on fundamentals, combined technical and fundamentals, and on price alone (similar to IBD). The site also shows daily industry movements. |
||||||||||||||||||||||||||||||||||||||||
# of Breakouts
|
Period Average1
|
Max. Gain During Period2
|
Gain at Period Close3
|
|
|---|---|---|---|---|
| This Week | 5 | 15.62 | 1.99% | 1.45% |
| Last Week | 6 | 15.54 | 3.22% | 0.9% |
| 13 Weeks | 213 | 15.92 | 17.85% |
-3.36% |
Sector
|
Industry
|
Breakout Count for Week
|
|---|---|---|
CONSUMER DURABLES
|
Electronic Equipment
|
1
|
CONSUMER NON-DURABLES
|
Cleaning Products
|
1
|
FINANCIAL SERVICES
|
Closed-End Fund - Equity
|
1
|
FINANCIAL SERVICES
|
Closed-End Fund - Debt
|
1
|
MANUFACTURING
|
Pollution & Treatment Controls
|
1
|
2This represents the return if each stock were bought at its breakout price and sold at its intraday high.
3This represents the return if each stock were bought at its breakout price and sold at the most recent close.
Category |
Symbol |
Company Name |
Expected Gain1 |
|---|---|---|---|
| Best Overall | OSTE | Osteotech Inc | 89 |
| Top Technical | AMPL | Ampal-Amer Israel Cl A | 77 |
| Top Fundamental | AOB | American Oriental Bioengineering Inc | 68 |
| Top Tech. & Fund. | BCPC | BALCHEM CP | 45 |
Category |
Symbol |
Company Name |
Expected Gain1 |
|---|---|---|---|
| Best Overall | SDD | ULTRASHORT SMALLCAP6 | 27 |
| Top Technical | DCI | Donaldson Co Inc | 0 |
| Top Fundamental | CHD | Church & Dwight Co Inc | 22 |
| Top Tech. & Fund. | CHD | Church & Dwight Co Inc | 22 |
If you received this newletter from a friend and you would like to receive it regularly please go to the BreakoutWatch.com site and enter as a Guest. You will then be able to register to receive the newsletter.
Copyright © 2007 NBIcharts, LLC dba BreakoutWatch.com. All rights reserved.
" BreakoutWatch," the BreakoutWatch.com "eye" logo, and the slogan "tomorrow's breakouts today" are service marks of NBIcharts LLC. All other marks are the property of their respective owners, and are used for descriptive purposes only.