| Market Summary | Weekly Breakout Report | Top Breakout Choices | Top 2nd Chances | New Features | Tip of the Week |
Special End-of-Year Promotion
We've slashed our rates by 30-50% until December 31, 2007 for subscriptions of 3-months or more.
You can extend your existing subscription at these rates even if it expires several days, weeks or months from now.
NEW WATCHLIST COMING JANUARY 2: HIGH TIGHT FLAG
(see this week's Top Tip for a potential high growth stock)
Act now to renew or upgrade your subscription at these special rates.
(Login and go to Account Management > Renew or Upgrade)
If you are not a subscriber, first enroll for a free trial and then upgrade to a full subscription
Market Summary
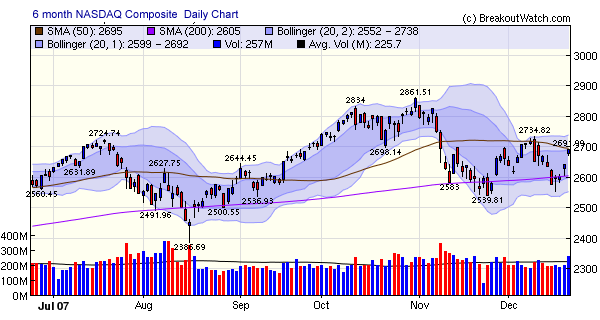
The NASDAQ Composite had its best week since the end of October with a gain of 2.13% and will likely run out to have the best performance of the Year. Currently the index has gained 11.46% compared to only 4.66% for the S&P 500 and 7.92% for the DJI. Bloomberg reports that analysts expect the Technology sector to average growth of 24% in 2008 and outperform all other sectors. If so, then we can expect more successful and more profitable breakouts from the NASDAQ next year.
The markets were enthused on Friday about robust consumer spending, but it is difficult to see how that can be sustained in the face of increasing credit costs and falling house prices. In the short term, the markets need to overcome some significant points of resistance. For instance, the 50 day moving average just crossed below the 200 day moving average for the S&P 500 and the index has yet to clear either of those levels. The NASDAQ is also knocking on its 50 day moving average and all three indexes face a resistance level set on December 11, as illustrated by the 6 month daily NASDAQ chart.

We can expect light trading next week due to the Christmas holiday.
We would like to take this opportunity to thank all our subscribers and readers for their support this year and we wish you a very Merry Christmas and a Happy and Prosperous New Year.
No new features this week.
High Tight Flag Coming In January
In How to Make Money in Stocks, William J. O'Neil identified the High, Tight Flag pattern as rare but potentially highly profitable. In his Encyclopedia of Chart Patterns, (John Wiley and Sons, 2000) Thomas Bulkowski found they were not so rare but also very profitable, provided you waited for the breakout to enter the trade. We have now developed an algorithm to recognize the pattern and found that it was rare in comparison to the cup-with-handle (CwH) but still found quite often.
Our algorithm looks for stocks that meet the following criteria:
- they must have formed a handle within the last 3 weeks of trading
- the handle must be at least 5 days long (we may reduce this on further research)
- the decline in the handle must be no more than 20%
- there must have been a gain of at least 100% in the eight weeks prior to the handle formation
- there is no minimum price or volume requirement (we may add a minimum volume in the future)
Some definitions of the high,tight flag (HTF) require that the stock be moving sideways before the rise and that volume be declining in the handle (like the CwH). We have not incorporated those criteria in the algorithm.
We will release a new watchlist and alert service on January 2 using the HTF pattern. We will publish some performance figures for the last year in next weeks newsletter. The charts shown below are samples of what we found while looking for HTF's over the last year. The chart format is generated automatically by the pattern recognition algorithm and these will be linked to the watchlist, as our other charts are.
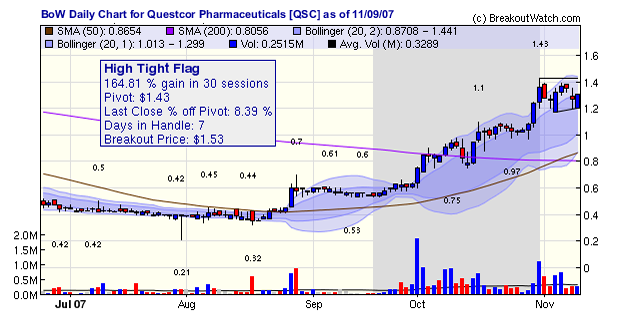
An example of a very successful HTF that we found was Questcor Pharmaceuticals (QSC). As of November 9,2007 it had been in an HTF pattern for 7 days:

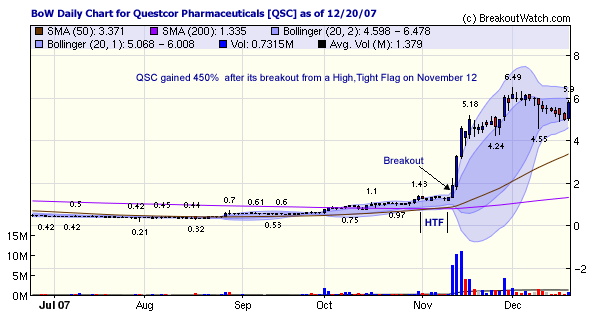
QSC broke out on November 12 and went on to gain 400% by yesterday's close.

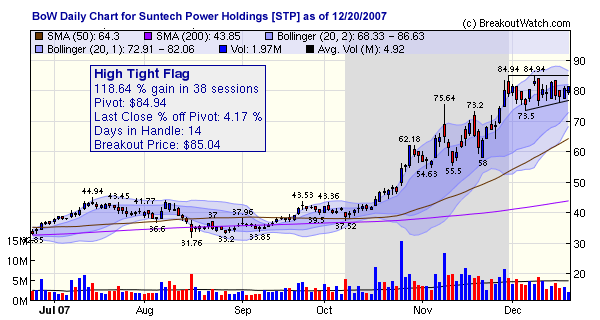
As of last Thursday evening, Suntech Power Holdings (STP) was in an HTF and broke out on Friday. This is one to watch. We took a major position in it intraday on Friday.

Investment Advisors Using our Service
TradeRight Securities, located in a suburb of Chicago, is a full services investment management company and broker/dealer. They have been a subscriber, and user, of BreakoutWatch.com for some time now. They practice CANTATA and use Breakoutwatch.com as a “research analyst”. You can learn more about TradeRight Securities at: www.traderightsecurities.com. If you’re interested in speaking to a representative, simply call them toll-free at 1-800-308-3938 or e-mail gdragel@traderightsecurities.com.
Note to advisors: If you would like to be listed here, please contact us. As a service to those who subscribe to us, there is no additional charge to be listed here.
Get a 14 day free
Trial of our premium 'Platinum' service and TradeWatch.
No Credit Card Required.
Click
Here for 14 Day Free Trial |
| Index | Value | Change Week | Change YTD | Market1 Signal |
||||||||||||||||||||||||||||||||||||
|---|---|---|---|---|---|---|---|---|---|---|---|---|---|---|---|---|---|---|---|---|---|---|---|---|---|---|---|---|---|---|---|---|---|---|---|---|---|---|---|---|
| Dow | 13450.7 | 0.83% | 7.92% | enter | ||||||||||||||||||||||||||||||||||||
| NASDAQ | 2691.99 | 2.13% | 11.46% | enter | ||||||||||||||||||||||||||||||||||||
| S&P 500 | 1484.46 | 1.12% | 4.66% | enter | ||||||||||||||||||||||||||||||||||||
1The Market Signal is derived from our proprietary
market model. The market model is described on the site. 2The site also shows industry rankings based on fundamentals, combined technical and fundamentals, and on price alone (similar to IBD). The site also shows daily industry movements. |
||||||||||||||||||||||||||||||||||||||||
# of Breakouts
|
Period Average1
|
Max. Gain During Period2
|
Gain at Period Close3
|
|
|---|---|---|---|---|
| This Week | 27 | 15.38 | 3.8% | 2.46% |
| Last Week | 11 | 16.23 | 7.5% | 3.18% |
| 13 Weeks | 224 | 17.31 | 12.9% |
0.37% |
Sector
|
Industry
|
Breakout Count for Week
|
|---|---|---|
AEROSPACE/DEFENSE
|
Aerospace/Defense Products & Services
|
2
|
DIVERSIFIED SERVICES
|
Business Services
|
2
|
ENERGY
|
Independent Oil & Gas
|
2
|
BANKING
|
Money Center Banks
|
1
|
CHEMICALS
|
Synthetics
|
1
|
CHEMICALS
|
Specialty Chemicals
|
1
|
COMPUTER SOFTWARE & SERVICES
|
Application Software
|
1
|
COMPUTER SOFTWARE & SERVICES
|
Business Software & Services
|
1
|
COMPUTER SOFTWARE & SERVICES
|
Multimedia & Graphics Software
|
1
|
DRUGS
|
Biotechnology
|
1
|
DRUGS
|
Drug Delivery
|
1
|
ELECTRONICS
|
Diversified Electronics
|
1
|
ELECTRONICS
|
Scientific & Technical Instruments
|
1
|
ENERGY
|
Major Integrated Oil & Gas
|
1
|
FINANCIAL SERVICES
|
Closed-End Fund - Equity
|
1
|
HEALTH SERVICES
|
Medical Instruments & Supplies
|
1
|
HEALTH SERVICES
|
Medical Appliances & Equipment
|
1
|
INSURANCE
|
Property & Casualty Insurance
|
1
|
MANUFACTURING
|
Metal Fabrication
|
1
|
METALS & MINING
|
Steel & Iron
|
1
|
TELECOMMUNICATIONS
|
Communication Equipment
|
1
|
TELECOMMUNICATIONS
|
Telecom Services - Domestic
|
1
|
UTILITIES
|
Electric Utilities
|
1
|
UTILITIES
|
Diversified Utilities
|
1
|
2This represents the return if each stock were bought at its breakout price and sold at its intraday high.
3This represents the return if each stock were bought at its breakout price and sold at the most recent close.
Category |
Symbol |
Company Name |
Expected Gain1 |
|---|---|---|---|
| Best Overall | KAZ | Bmb Munai Inc | 86 |
| Top Technical | SHEN | Shenandoah Telecomm | 28 |
| Top Fundamental | BAP | Credicorp Ltd | 32 |
| Top Tech. & Fund. | BAP | Credicorp Ltd | 32 |
Category |
Symbol |
Company Name |
Expected Gain1 |
|---|---|---|---|
| Best Overall | OFG | Oriental Financial Group | 57 |
| Top Technical | VSCN | VISUAL SCIENCES INC | 31 |
| Top Fundamental | TWGP | Tower Grp Inc | 30 |
| Top Tech. & Fund. | TWGP | Tower Grp Inc | 30 |
If you received this newletter from a friend and you would like to receive it regularly please go to the BreakoutWatch.com site and enter as a Guest. You will then be able to register to receive the newsletter.
Copyright © 2007 NBIcharts, LLC dba BreakoutWatch.com. All rights reserved.
" BreakoutWatch," the BreakoutWatch.com "eye" logo, and the slogan "tomorrow's breakouts today" are service marks of NBIcharts LLC. All other marks are the property of their respective owners, and are used for descriptive purposes only.