| Market Summary | Weekly Breakout Report | Top Breakout Choices | Top 2nd Chances | New Features | Tip of the Week |
Market Summary
NASDAQ Continues Rally
Last week we expected the NASDAQ to again test support at its lower channel but instead it delivered four successive accumulation days and closed above its 200 day moving average. Although volume increased each day, it was anemic until Friday when it rose above the 50 day moving average. Friday's surge was a result of beaten-down PC manufacturer DELL beating the street's earnings expectations but followed a week of developing strength in the technology sector. For example, Google gained 8.3% for the week while the index as a whole added 3.19% easily outpacing the DJI and S&P 500.
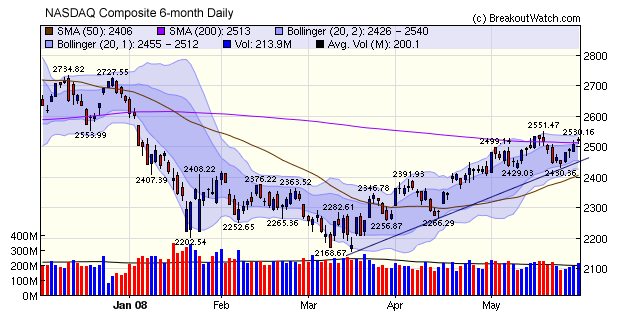
The smaller cap stocks did well also with the Russell 2000 gaining 3.33%.
When the NASDAQ last broke through the 200 dma level two weeks ago it met with strong resistance. As it breaks through again, we will be interested to see if it can sustain uits progress. If not, there is a potential for a bearish head and shoulders top to form.
The number of breakouts jumped to 27 this week with only two failing to deliver a gain by week's end, and then by less than 1% from their breakout price.| B'out Date |
Symbol | Base | B'Out Price |
Last Close |
Current
% off BOP |
*Gain at Intraday High |
Expected Gain % |
|---|---|---|---|---|---|---|---|
| 05/30/08 | ENER | HTF | 58.69 | 61.46 | 4.72% | 9.98% | N/A |
| 05/30/08 | CLR | HTF | 63.69 | 64.17 | 0.75% | 2.86% | N/A |
| 05/30/08 | TWLL | CwH | 13.00 | 13.02 | 0.15% | 2.31% | 74 |
| 05/30/08 | SEAC | CwH | 7.75 | 7.86 | 1.42% | 5.94% | 94 |
| 05/30/08 | PTC | CwH | 8.90 | 9.4 | 5.62% | 5.73% | 60 |
| 05/30/08 | OCNF | CwH | 26.45 | 26.52 | 0.26% | 0.87% | 53 |
| 05/30/08 | NTCT | CwH | 12.49 | 12.71 | 1.76% | 3.36% | 73 |
| 05/30/08 | HRS | CwH | 65.36 | 65.78 | 0.64% | 2.07% | 37 |
| 05/30/08 | GDP | CwH | 39.50 | 42.6 | 7.85% | 9.14% | 45 |
| 05/30/08 | ESL | CwH | 59.27 | 61.93 | 4.49% | 5.79% | 45 |
| 05/30/08 | AVAV | CwH | 25.70 | 26.23 | 2.06% | 4.63% | 43 |
| 05/30/08 | ACM | CwH | 32.13 | 32.21 | 0.25% | 1.28% | 40 |
| 05/30/08 | ACFN | CwH | 6.40 | 6.47 | 1.09% | 1.56% | 110 |
| 05/29/08 | SOHU | HTF | 85.93 | 87.16 | 1.43% | 2.54% | N/A |
| 05/29/08 | SDXC | CwH | 16.91 | 17.62 | 4.20% | 5.68% | 58 |
| 05/29/08 | PMACA | CwH | 10.00 | 9.98 | -0.20% | 2.3% | 63 |
| 05/29/08 | KHD | CwH | 34.55 | 35.1 | 1.59% | 3.42% | 41 |
| 05/29/08 | GMCR | CwH | 41.68 | 43.16 | 3.55% | 4.85% | 55 |
| 05/29/08 | DR | CwH | 28.39 | 28.44 | 0.18% | 1.66% | 32 |
| 05/29/08 | AAP | CwH | 40.24 | 40.3 | 0.15% | 2.56% | 38 |
| 05/28/08 | WH | HTF | 8.43 | 8.37 | -0.71% | 0.59% | N/A |
| 05/28/08 | NR | CwH | 7.00 | 7.05 | 0.71% | 11% | 83 |
| 05/28/08 | NETL | CwH | 36.07 | 37.48 | 3.91% | 5.16% | 49 |
| 05/28/08 | MR | CwH | 40.32 | 41.9 | 3.92% | 3.92% | 49 |
| 05/28/08 | FLDR | CwH | 6.94 | 7.19 | 3.60% | 7.06% | 93 |
| 05/28/08 | EBS | CwH | 10.05 | 10.75 | 6.97% | 6.97% | 87 |
| 05/28/08 | DCI | CwH | 47.57 | 51.48 | 8.22% | 10.01% | 48 |
| 05/27/08 | TRLG | CwH | 24.76 | 25.25 | 1.98% | 4.6% | 50 |
| 05/27/08 | STMP | CwH | 14.38 | 14.6 | 1.53% | 4.31% | 45 |
| 05/27/08 | NGAS | CwH | 8.96 | 9.1 | 1.56% | 4.35% | 73 |
| 05/27/08 | FUQI | CwH | 9.80 | 11.28 | 15.10% | 17.35% | 86 |
No New Features this Week
Get a 14 day free
Trial of our premium 'Platinum' service and TradeWatch.
No Credit Card Required.
Click
Here for 14 Day Free Trial |
| Index | Value | Change Week | Change YTD | Market1 Signal |
||||||||||||||||||||||||||||||||||||
|---|---|---|---|---|---|---|---|---|---|---|---|---|---|---|---|---|---|---|---|---|---|---|---|---|---|---|---|---|---|---|---|---|---|---|---|---|---|---|---|---|
| Dow | 12638.3 | 1.27% | -4.72% | enter | ||||||||||||||||||||||||||||||||||||
| NASDAQ | 2522.66 | 3.19% | -4.89% | enter | ||||||||||||||||||||||||||||||||||||
| S&P 500 | 1400.38 | 1.78% | -4.63% | enter | ||||||||||||||||||||||||||||||||||||
| Russell 2000 | 748.21 | 3.33% | -2.33% | N/A | ||||||||||||||||||||||||||||||||||||
1The Market Signal is derived from our proprietary
market model. The market model is described on the site. 2The site also shows industry rankings based on fundamentals, combined technical and fundamentals, and on price alone (similar to IBD). The site also shows daily industry movements. |
||||||||||||||||||||||||||||||||||||||||
# of Breakouts |
Period Average1 |
Max. Gain During Period2 |
Gain at Period Close3 |
|
|---|---|---|---|---|
| This Week | 27 | 21.31 | 5.11% | 3.06% |
| Last Week | 12 | 22.38 | 9.81% | 4.76% |
| 13 Weeks | 290 | 23.69 | 18.35% |
6.85% |
Sector |
Industry |
Breakout Count for Week |
|---|---|---|
AEROSPACE/DEFENSE |
Aerospace/Defense Products & Services |
2 |
INSURANCE |
Property & Casualty Insurance |
2 |
COMPUTER HARDWARE |
Computer Peripherals |
1 |
COMPUTER SOFTWARE & SERVICES |
Business Software & Services |
1 |
CONSUMER DURABLES |
Recreational Goods, Other |
1 |
CONSUMER DURABLES |
Business Equipment |
1 |
CONSUMER NON-DURABLES |
Textile - Apparel Clothing |
1 |
DIVERSIFIED SERVICES |
Technical Services |
1 |
DRUGS |
Biotechnology |
1 |
ELECTRONICS |
Semiconductor Equipment & Materials |
1 |
ELECTRONICS |
Semiconductor - Memory Chips |
1 |
ENERGY |
Oil & Gas Drilling & Exploration |
1 |
ENERGY |
Independent Oil & Gas |
1 |
ENERGY |
Oil & Gas Equipment & Services |
1 |
FOOD & BEVERAGE |
Processed & Packaged Goods |
1 |
HEALTH SERVICES |
Medical Instruments & Supplies |
1 |
MANUFACTURING |
Pollution & Treatment Controls |
1 |
MANUFACTURING |
Diversified Machinery |
1 |
RETAIL |
Auto Parts Stores |
1 |
RETAIL |
Catalog & Mail Order Houses |
1 |
TELECOMMUNICATIONS |
Processing Systems & Products |
1 |
TELECOMMUNICATIONS |
Communication Equipment |
1 |
TELECOMMUNICATIONS |
Diversified Communication Services |
1 |
TRANSPORTATION |
Shipping |
1 |
WHOLESALE |
Industrial Equipment Wholesale |
1 |
2This represents the return if each stock were bought at its breakout price and sold at its intraday high.
3This represents the return if each stock were bought at its breakout price and sold at the most recent close.
Category |
Symbol |
Company Name |
Expected Gain1 |
|---|---|---|---|
| Best Overall | CHP | C&D Technologies Inc | 113 |
| Top Technical | MXB | MSCI INC | 52 |
| Top Fundamental | EGLE | Eagle Bulk Shipping Inc | 61 |
| Top Tech. & Fund. | EGLE | Eagle Bulk Shipping Inc | 61 |
Category |
Symbol |
Company Name |
Expected Gain1 |
|---|---|---|---|
| Best Overall | ACFN | ACORN ENERGY INC | 110 |
| Top Technical | TRLG | True Religion Apparel Inc | 50 |
| Top Fundamental | SEAC | Seachange Internat Inc | 94 |
| Top Tech. & Fund. | DR | Darwin Professional Underwriters Inc | 32 |
If you received this newletter from a friend and you would like to receive it regularly please go to the BreakoutWatch.com site and enter as a Guest. You will then be able to register to receive the newsletter.
Copyright © 2008 NBIcharts, LLC dba BreakoutWatch.com. All rights reserved.
" BreakoutWatch," the BreakoutWatch.com "eye" logo, and the slogan "tomorrow's breakouts today" are service marks of NBIcharts LLC. All other marks are the property of their respective owners, and are used for descriptive purposes only.