| Market Summary | Weekly Breakout Report | Top Breakout Choices | Top 2nd Chances | New Features | Tip of the Week |
Market Summary
NASDAQ Market Signal switches to 'exit'
Friday's trading produced the fifth distribution day in 13 sessions for the NASDAQ and our market model issued an 'exit' signal. The weekly chart shows volume above the 50 day average for the last three weeks and also higher than volumes when the index was ascending from mid-March to May. The implication is that the optimism that followed the Bear Sterns bailout has evaporated and investors are now expecting that the financial crisis is not yet over, that the economy will continue to decline as the dollar continues to fall, inflation increases and consumers are continually assaulted by falling home prices, foreclosures and a credit squeeze.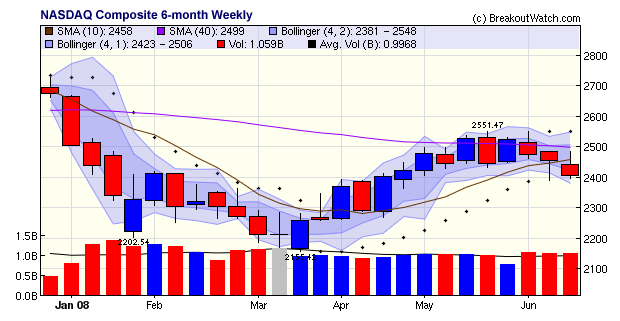
The short term solution to the falling dollar and consequent inflation of food and energy is to raise interest rates but that would further depress the equities markets that have already factored in a rate increase by September and exacerbate the credit crunch. It seems things will have to get worse before they can get better.
Of course, its always darkest before the dawn and we can look forward to more articles like this to deepen the gloom (from the London Daily Telegraph):
RBS issues global stock and credit crash alert
The
Royal Bank of Scotland has advised clients to brace for a full-fledged
crash in global stock and credit markets over the next three months as
inflation paralyses the major central banks.
"A very nasty period is soon to be upon us - be prepared," said Bob
Janjuah, the bank's credit strategist.
A
report by the bank's research team warns that the S&P 500 index
of
Wall Street equities is likely to fall by more than 300 points to
around 1050 by September as "all the chickens come home to roost" from
the excesses of the global boom, with contagion spreading across Europe
and emerging markets.
Such a slide on world bourses would amount to one of the worst bear markets over the last century.
Get a 14 day free
Trial of our premium 'Platinum' service and TradeWatch.
No Credit Card Required.
Click
Here for 14 Day Free Trial |
| Index | Value | Change Week | Change YTD | Market1 Signal |
||||||||||||||||||||||||||||||||||||
|---|---|---|---|---|---|---|---|---|---|---|---|---|---|---|---|---|---|---|---|---|---|---|---|---|---|---|---|---|---|---|---|---|---|---|---|---|---|---|---|---|
| Dow | 11842.7 | -3.77% | -10.72% | enter | ||||||||||||||||||||||||||||||||||||
| NASDAQ | 2406.09 | -1.97% | -9.28% | exit | ||||||||||||||||||||||||||||||||||||
| S&P 500 | 1317.93 | -3.1% | -10.24% | enter | ||||||||||||||||||||||||||||||||||||
| Russell 2000 | 725.73 | -1.07% | -5.26% | N/A | ||||||||||||||||||||||||||||||||||||
1The Market Signal is derived from our proprietary
market model. The market model is described on the site. 2The site also shows industry rankings based on fundamentals, combined technical and fundamentals, and on price alone (similar to IBD). The site also shows daily industry movements. |
||||||||||||||||||||||||||||||||||||||||
# of Breakouts |
Period Average1 |
Max. Gain During Period2 |
Gain at Period Close3 |
|
|---|---|---|---|---|
| This Week | 20 | 22.23 | 5.91% | 2.17% |
| Last Week | 13 | 21.54 | 6.53% | -3.51% |
| 13 Weeks | 307 | 23.15 | 14.45% |
4.4% |
Sector |
Industry |
Breakout Count for Week |
|---|---|---|
MANUFACTURING |
Diversified Machinery |
2 |
TELECOMMUNICATIONS |
Diversified Communication Services |
2 |
CHEMICALS |
Specialty Chemicals |
1 |
COMPUTER SOFTWARE & SERVICES |
Business Software & Services |
1 |
COMPUTER SOFTWARE & SERVICES |
Technical & System Software |
1 |
DIVERSIFIED SERVICES |
Business Services |
1 |
DIVERSIFIED SERVICES |
Technical Services |
1 |
DRUGS |
Drug Manufacturers - Other |
1 |
DRUGS |
Biotechnology |
1 |
ELECTRONICS |
Semiconductor Equipment & Materials |
1 |
ENERGY |
Oil & Gas Drilling & Exploration |
1 |
ENERGY |
Oil & Gas Equipment & Services |
1 |
FINANCIAL SERVICES |
Asset Management |
1 |
HEALTH SERVICES |
Medical Instruments & Supplies |
1 |
MEDIA |
Publishing - Books |
1 |
METALS & MINING |
Steel & Iron |
1 |
RETAIL |
Catalog & Mail Order Houses |
1 |
SPECIALTY RETAIL |
Sporting Goods Stores |
1 |
2This represents the return if each stock were bought at its breakout price and sold at its intraday high.
3This represents the return if each stock were bought at its breakout price and sold at the most recent close.
Category |
Symbol |
Company Name |
Expected Gain1 |
|---|---|---|---|
| Best Overall | WH | WSP HOLDINGS LIMITED | 119 |
| Top Technical | MXB | MSCI INC | 49 |
| Top Fundamental | AMN | Ameron Internat Corp | 36 |
| Top Tech. & Fund. | MXB | MSCI INC | 49 |
Category |
Symbol |
Company Name |
Expected Gain1 |
|---|---|---|---|
| Best Overall | MALL | Pc Mall Inc | 77 |
| Top Technical | ASMI | Asm Internat N.V. | 56 |
| Top Fundamental | JWA | John Wiley & Sons Cl A | 37 |
| Top Tech. & Fund. | JWA | John Wiley & Sons Cl A | 37 |
If you received this newletter from a friend and you would like to receive it regularly please go to the BreakoutWatch.com site and enter as a Guest. You will then be able to register to receive the newsletter.
Copyright © 2008 NBIcharts, LLC dba BreakoutWatch.com. All rights reserved.
" BreakoutWatch," the BreakoutWatch.com "eye" logo, and the slogan "tomorrow's breakouts today" are service marks of NBIcharts LLC. All other marks are the property of their respective owners, and are used for descriptive purposes only.