| Market Summary | Weekly Breakout Report | Top Breakout Choices | Top 2nd Chances | New Features | Tip of the Week |
Market Summary
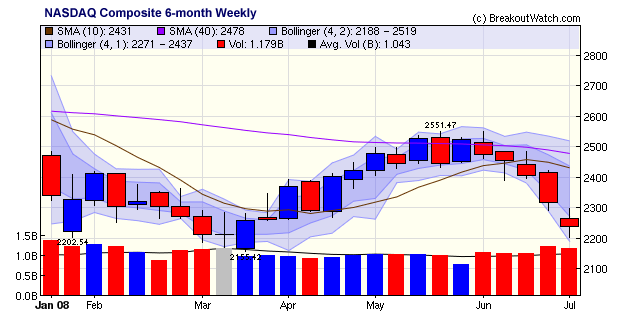
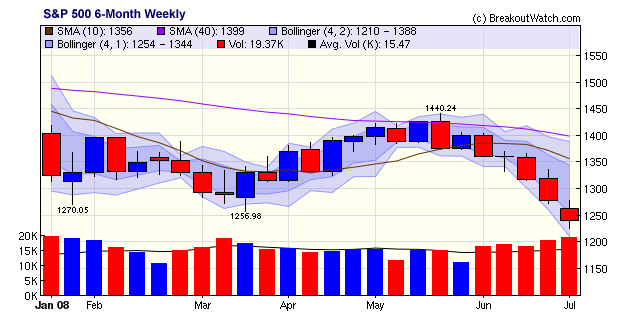
The technical condition of the market continues to decline and further losses are in store. The two charts below, of the NASDAQ Composite and S&P 500 show how the markets have fallen now for five successive weeks and that the volume trend is up. That means distribution is accelerating. Note that during the bear market rally mid-March to mid-June, the weekly volume was always below the 13 week average, meaning that accumulation never overcame the distribution that had preceded, while over the last five weeks, volume has been consistently above the average.
Adding to this gloomy picture, investment manager Bridgewater Associates now estimates that global financial losses will rise to $1.6 trillion. That is four times the value of writedowns that have been recognized so far. It is clear things are going to get worse! Just how much worse is described by Nouriel Roubini in his blog yesterday. The Professor was among the first to warn of the impending crisis back in 2006 and was scoffed at during 2007 but lately has been accorded the respect due. In August of 2006 he correctly predicted the eventual severe losses at F&F. Readers of this newsletter know we have frequently quoted him and do so again now:
Roubini recommends being in cash or inflation-indexed bonds. He is also stridently opposed to the "mother of all bailouts" that a rescue of F&F would entail. See "How to Avoid the Mother of All Bailouts".
Are breakouts buyable when they pullback?
Conventional wisdom has it that you should not purchase a stock that has risen by more than 5% above its breakout price. The question then arises as to whether a stock that has risen above the 5% limit and then pulled back within that range is buyable. Our Recent Breakouts report lists all stocks that have broken out in the last 90 days and indicates which ones are within the 5% limit. It also shows the highest intraday high reached until the date of the report, so it is easy to identify those that have exceeded the 5% limit and then pulled back. The motivation behind the report is to show which stocks offer a second chance buying opportunity.
A subscriber asked if there was any analysis available of how these 'second chance' stocks perform. It is not a question we've studied so we undertook a brief analysis of how these second chance stocks perform compared to those that don't pull back. We looked at stocks that broke out from a cup-with-handle base in each year since 2004 and divided them into two groups:
- Stocks that exceeded the 5% limit within the first 30 days after breakout and then pulled back to within 5% of the breakout price
- Stocks that did not pullback to within range during the first 30 days after breakout.
We then looked at the highest closing price achieved either before they failed (that is fell to 8% below their breakout price) or during the 12 months following breakout if they did not fail within that 12 month period.
| Year | No. Brkouts |
No. > 5% | No. Pullbacks |
No. Fails |
Avg. Gain of Pullbacks |
Avg. Gain Non-Pullbacks |
|---|---|---|---|---|---|---|
| 2004 | 1223 | 975 | 831 | 639 | 37.5 | 75.0 |
| 2005 | 1327 | 1030 | 852 | 594 | 46.3 | 75.0 |
| 2006 | 1272 | 970 | 822 | 646 | 38.8 | 67.7 |
| 2007 | 676 | 533 | 444 | 369 | 27.7 | 59.4 |
| 2008 | 444 | 319 | 279 | 137 | 18.8 | 28.4 |
| Note: the number of breakouts fell in 2007, 2008 because we changed the watchlist criteria to only include stocks with an RS Rank of 80 or more instead of an RS Rank of 70 | ||||||
The results show that although the 'second chance' stocks perform less well than those that do not pullback, they nevertheless provide a very acceptable return.
We don't think this shows that you should automatically buy stocks that have pulled back within range. But what it does show is that if you hold a breakout that has not pulled back within 30 days, you should hold out for a bigger than average gain.
Get a 14 day free
Trial of our premium 'Platinum' service and TradeWatch.
No Credit Card Required.
Click
Here for 14 Day Free Trial |
| Index | Value | Change Week | Change YTD | Market1 Signal |
||||||||||||||||||||||||||||||||||||
|---|---|---|---|---|---|---|---|---|---|---|---|---|---|---|---|---|---|---|---|---|---|---|---|---|---|---|---|---|---|---|---|---|---|---|---|---|---|---|---|---|
| Dow | 11104.5 | -1.63% | -16.29% | enter | ||||||||||||||||||||||||||||||||||||
| NASDAQ | 2239.48 | -0.26% | -15.56% | exit | ||||||||||||||||||||||||||||||||||||
| S&P 500 | 1239.93 | -1.82% | -15.56% | enter | ||||||||||||||||||||||||||||||||||||
| Russell 2000 | 670.36 | -4.0% | -13.12% | N/A | ||||||||||||||||||||||||||||||||||||
1The Market Signal is derived from our proprietary
market model. The market model is described on the site. 2The site also shows industry rankings based on fundamentals, combined technical and fundamentals, and on price alone (similar to IBD). The site also shows daily industry movements. |
||||||||||||||||||||||||||||||||||||||||
# of Breakouts |
Period Average1 |
Max. Gain During Period2 |
Gain at Period Close3 |
|
|---|---|---|---|---|
| This Week | 10 | 23.15 | 4.83% | 1.96% |
| Last Week | 10 | 23.31 | 4.38% | 1.82% |
| 13 Weeks | 317 | 24.08 | 13.63% |
-2.32% |
Sector |
Industry |
Breakout Count for Week |
|---|---|---|
DIVERSIFIED SERVICES |
Rental & Leasing Services |
1 |
DRUGS |
Biotechnology |
1 |
FINANCIAL SERVICES |
Closed-End Fund - Equity |
1 |
FINANCIAL SERVICES |
Closed-End Fund - Debt |
1 |
HEALTH SERVICES |
Specialized Health Services |
1 |
HEALTH SERVICES |
Medical Appliances & Equipment |
1 |
HEALTH SERVICES |
Medical Instruments & Supplies |
1 |
METALS & MINING |
Gold |
1 |
RETAIL |
Home Furnishing Stores |
1 |
UTILITIES |
Electric Utilities |
1 |
2This represents the return if each stock were bought at its breakout price and sold at its intraday high.
3This represents the return if each stock were bought at its breakout price and sold at the most recent close.
Category |
Symbol |
Company Name |
Expected Gain1 |
|---|---|---|---|
| Best Overall | RNWK | Realnetworks Inc | 96 |
| Top Technical | HI | HILLENBRAND, INC. | 48 |
| Top Fundamental | NOA | NORTH AMERICAN ENERG | 54 |
| Top Tech. & Fund. | NOA | NORTH AMERICAN ENERG | 54 |
Category |
Symbol |
Company Name |
Expected Gain1 |
|---|---|---|---|
| Best Overall | HVT | Haverty Furniture Cos | 62 |
| Top Technical | CYBX | Cyberonics Inc | 49 |
| Top Fundamental | CYBX | Cyberonics Inc | 49 |
| Top Tech. & Fund. | CYBX | Cyberonics Inc | 49 |
If you received this newletter from a friend and you would like to receive it regularly please go to the BreakoutWatch.com site and enter as a Guest. You will then be able to register to receive the newsletter.
Copyright © 2008 NBIcharts, LLC dba BreakoutWatch.com. All rights reserved.
" BreakoutWatch," the BreakoutWatch.com "eye" logo, and the slogan "tomorrow's breakouts today" are service marks of NBIcharts LLC. All other marks are the property of their respective owners, and are used for descriptive purposes only.