| Market Summary | Weekly Breakout Report | Top Breakout Choices | Top 2nd Chances | New Features | Tip of the Week |
The
DJI made its biggest one week gain measured from close to close since
March 21, 2003 after a week of erratic trading which saw the VIX reach
its highest level ever on Friday. For the S&P 500 it was the best
week since February and for the NASDAQ the best since August 8. The
performance could have been better were it not for a late sell-off on
Friday driven either by traders closing positions before the weekend,
mutual fund redemptions or the settling of options contracts.
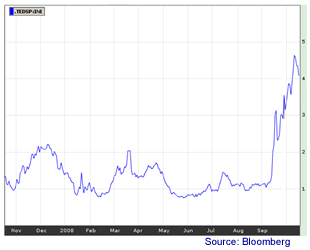
Friday also saw the TED Spead ease the most for the week as it fell by 11%. But as the following chart of the TED spread over the last year shows, it has a long way to fall before inter-bank lending will revert to its more normal level. We can think of the TED spread as an index of fear - a measure of the extent to which banks distrust one another and fear they will not be repaid for any loans they make. Until this fear index comes down volatility will continue.
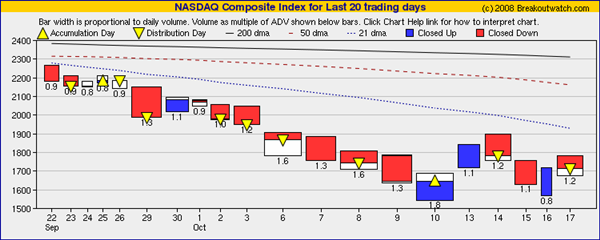
We usually study the NASDAQ chart because that's where we expect growth stocks to come from and despite this weeks gains our equivolume chart shows that the index is still under distribution with only one accumulation day in the last twenty.
Stocks have become so beaten down that there are very few breakout choices at the moment with just eight on our cup-with-handle list which usually has the most choices. Our head and shoulders bottom list, which probably holds the most promise if the rally continues, has 12 choices.
By far the most rewarding selections have been from our short sale lists. Over the last 13 weeks we selected 205 breakdowns which gave an average return of 84% to their intra-day low from the breakdown price. Breakdowns continue to perform well with nine this week for an average 1 day retun of 5%.
Tables
Friday also saw the TED Spead ease the most for the week as it fell by 11%. But as the following chart of the TED spread over the last year shows, it has a long way to fall before inter-bank lending will revert to its more normal level. We can think of the TED spread as an index of fear - a measure of the extent to which banks distrust one another and fear they will not be repaid for any loans they make. Until this fear index comes down volatility will continue.
We usually study the NASDAQ chart because that's where we expect growth stocks to come from and despite this weeks gains our equivolume chart shows that the index is still under distribution with only one accumulation day in the last twenty.
Stocks have become so beaten down that there are very few breakout choices at the moment with just eight on our cup-with-handle list which usually has the most choices. Our head and shoulders bottom list, which probably holds the most promise if the rally continues, has 12 choices.
By far the most rewarding selections have been from our short sale lists. Over the last 13 weeks we selected 205 breakdowns which gave an average return of 84% to their intra-day low from the breakdown price. Breakdowns continue to perform well with nine this week for an average 1 day retun of 5%.
| B'down Date | Symbol | Base | B'down Price |
B'down Day Close |
B'Down day % Gain |
|---|---|---|---|---|---|
| 10/15/08 | FDRY | HS | 16.98 | 15.54 | 9.27 |
| 10/15/08 | FNFG | HS | 14.91 | 13.97 | 6.73 |
| 10/15/08 | LAZ | HS | 36 | 35.05 | 2.71 |
| 10/15/08 | NCI | SS | 17.21 | 16.26 | 5.84 |
| 10/15/08 | DWA | HS | 27.2 | 26.7 | 1.87 |
| 10/15/08 | NUVA | HS | 45.11 | 43.25 | 4.30 |
| 10/15/08 | THOR | HS | 24.9 | 24.73 | 0.69 |
| 10/14/08 | SCHW | HS | 23.03 | 20.97 | 9.82 |
| 10/14/08 | PACW | HS | 27.84 | 26.77 | 4.00 |
| Average one day gain | 5.03 | ||||
No new features this week.
No tip this week.
| Index | Value | Change Week | Change YTD | ||||||||||||||||||||||||||||||||||||
|---|---|---|---|---|---|---|---|---|---|---|---|---|---|---|---|---|---|---|---|---|---|---|---|---|---|---|---|---|---|---|---|---|---|---|---|---|---|---|---|
| Dow | 8852.22 | 4.75% | -33.27% | ||||||||||||||||||||||||||||||||||||
| NASDAQ | 1711.29 | 3.75% | -35.48% | ||||||||||||||||||||||||||||||||||||
| S&P 500 | 940.55 | 4.6% | -35.95% | ||||||||||||||||||||||||||||||||||||
| Russell 2000 | 526.43 | 0.77% | -31.28% | ||||||||||||||||||||||||||||||||||||
1The Market Signal is derived from our proprietary
market model. The market model is described on the site. 2The site also shows industry rankings based on fundamentals, combined technical and fundamentals, and on price alone. The site also shows daily industry movements. |
|||||||||||||||||||||||||||||||||||||||
# of Breakouts |
Period Average1 |
Max. Gain During Period2 |
Gain at Period Close3 |
|
|---|---|---|---|---|
| This Week | 22.62 | 0% | 0% | |
| Last Week | 1 | 23.69 | 3.65% | -26.58% |
| 13 Weeks | 317 | 23.69 | 13.62% |
-20.27% |
2This represents the return if each stock were bought at its breakout price and sold at its intraday high.
3This represents the return if each stock were bought at its breakout price and sold at the most recent close.
Category |
Symbol |
Company Name |
Expected Gain1 |
|---|---|---|---|
| Best Overall | HEV | ENER1 INC NEW | 87 |
| Top Technical | SINT | Si International | 26 |
| Top Fundamental | GXDX | GENOPTIX, INC. | 37 |
| Top Tech. & Fund. | GXDX | GENOPTIX, INC. | 37 |
Category |
Symbol |
Company Name |
Expected Gain1 |
|---|---|---|---|
| With no breakouts this week, there are no second chances. |
|||
If you received this newletter from a friend and you would like to receive it regularly please go to the BreakoutWatch.com site and enter as a Guest. You will then be able to register to receive the newsletter.
Copyright © 2008 NBIcharts, LLC dba BreakoutWatch.com.
All rights reserved.
"
BreakoutWatch," the BreakoutWatch.com "eye" logo, and the
slogan "tomorrow's breakouts today" are service marks of NBIcharts
LLC. All other marks are the property of their respective owners, and are
used for descriptive purposes only.
BreakoutWatch is not affiliated with Investor's Business Daily or with Mr. William O'Neil.
Our site, research and analysis is supported entirely by subscription and is free from advertising.