| Market Summary | Weekly Breakout Report | Top Breakout Choices | Top 2nd Chances | New Features | Tip of the Week |
Market
volatility remains high and despite a massive one-day gain on Thursday,
the markets continued their downward trend with the Russell 2000 and
NASDAQ Composite experiencing the biggest losses for the week as job
losses mount, consumer spending contracts and credit remains tight.
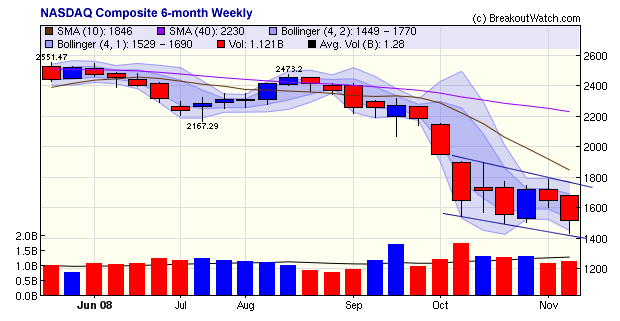
The NASDAQ, like all the indexes we follow, set new lows for the year on Thursday before the intraday recovery. The trend, as analyzed by our market model, and as shown in the following chart, remains in a downward channel with successive lower lows and lower highs.
While volatility may be beloved by traders it is a nightmare for the swing or medium term investor. For the swing trader, the most profitable place to make money over the last few weeks has been in short breakdowns rather than long breakouts. The following table shows the comparison over the last 13 weeks.:
Number of Sustained Breakouts |
171 |
Avg % gain to intra-day high |
13.48% |
Number of Sustained Breakdowns |
181 |
Avg % Gain to intra-day low |
82.5% |
No new
features this week.
This tip is no longer available.
| Index | Value | Change Week | Change YTD | Trend | ||||||||||||||||||||||||||||||||||||
|---|---|---|---|---|---|---|---|---|---|---|---|---|---|---|---|---|---|---|---|---|---|---|---|---|---|---|---|---|---|---|---|---|---|---|---|---|---|---|---|---|
| Dow | 8497.31 | -4.99% | -35.94% | Down | ||||||||||||||||||||||||||||||||||||
| NASDAQ | 1516.85 | -7.92% | -42.81% | Down | ||||||||||||||||||||||||||||||||||||
| S&P 500 | 873.29 | -6.2% | -40.53% | Down | ||||||||||||||||||||||||||||||||||||
| Russell 2000 | 456.52 | -9.74% | -40.4% | Down | ||||||||||||||||||||||||||||||||||||
| Wilshire 5000 | 8721.88 | -6.8% | -41.3% | Down | ||||||||||||||||||||||||||||||||||||
1The
Market Signal is derived from our proprietary
market model. The market model is described on the site.
2The site also shows industry rankings based on fundamentals, combined technical and fundamentals, and on price alone. The site also shows daily industry movements. |
||||||||||||||||||||||||||||||||||||||||
|
# of Breakouts
|
Period Average1
|
Max. Gain During Period2
|
Gain at Period Close3
|
|
|---|---|---|---|---|
| This Week | 9 | 13.54 | 4.67% | -3.01% |
| Last Week | 4 | 15.15 | 8.33% | -8.03% |
| 13 Weeks | 190 | 15.85 | 12.8% |
-24.43% |
2This represents the return if each stock were bought at its breakout price and sold at its intraday high.
3This represents the return if each stock were bought at its breakout price and sold at the most recent close.
|
Category
|
Symbol
|
Company Name
|
Expected Gain1
|
|---|---|---|---|
| Best Overall | FRBK | Republic First Bncp Inc | 86 |
| Top Technical | CYB | WISDOMTREE DREYFUS | 27 |
| Top Fundamental | GXDX | GENOPTIX, INC. | 41 |
| Top Tech. & Fund. | GXDX | GENOPTIX, INC. | 41 |
|
Category
|
Symbol
|
Company Name
|
Expected Gain1
|
|---|---|---|---|
| Best Overall | INT | World Fuel Service Corp | 72 |
| Top Technical | ASEI | American Science & Engineering Inc | 46 |
| Top Fundamental | DLTR | Dollar Tree Stores Inc | 42 |
| Top Tech. & Fund. | DLTR | Dollar Tree Stores Inc | 42 |
If you received this newsletter from a friend and you would like to receive it regularly please go to the BreakoutWatch.com site and enter as a Guest. You will then be able to register to receive the newsletter.
Copyright © 2008 NBIcharts, LLC dba BreakoutWatch.com.
All rights reserved.
"
BreakoutWatch," the BreakoutWatch.com "eye" logo, and the
slogan "tomorrow's breakouts today" are service marks of NBIcharts
LLC. All other marks are the property of their respective owners, and
are
used for descriptive purposes only.
BreakoutWatch is not affiliated with Investor's Business
Daily or with Mr. William O'Neil.
Our site, research and analysis is supported entirely by subscription
and is free from advertising.