| Market Summary | Weekly Breakout Report | Top Breakout Choices | Top 2nd Chances | New Features | Tip of the Week |
The
downward trend continued this week due mainly to Monday's sharp drop of
9% for the NASDAQ and S&P 500 and almost 12% for the Russell 2000.
Since then investors have been 'bottom fishing' and the S&P 500 has
managed three accumulation days and the NASDAQ and Russell 2000 two.
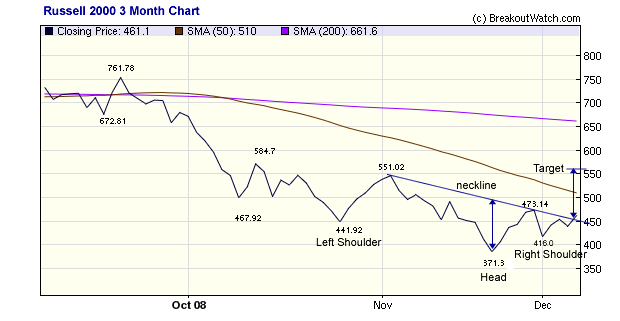
Since the low of the year on November 21, the major indexes have made some nice gains with the Russell 2000 appreciating by 24.2%, the S&P 500 by 18.3% and the NASDAQ Composite by 16.5%. The late afternoon surge on Friday allowed all the five indexes we follow to complete a head and shoulders bottom pattern similar to the one shown below for the Russell 2000. Unfortunately, the pattern was not completed on heavy volume so we are reluctant to predict any further upward movement. Should we get some heavier follow-through volume on Monday, then our target price for this base is 510 for the Russell, or a gain of something over 20%. The target is obtained by measuring from the neckline to head (low) and then adding it to the point where the pattern is completed. (The pattern is considered complete when the price rises above the neckline). As all the indexes are in a similar pattern, the target for the market as a whole is also approximately 20%.
The number of successful breakouts increased to five this week with a positive gain by Friday of 3.6%. The number of breakdowns was also five, down from eight the previous week. We're not suggesting there's a trend here but the ratio of breakouts to breakdowns bears watching in the days ahead.
Economic conditions and the light volume we have seen this week lead us to believe we are seeing a bear market rally but there could still be some interesting short term gains to be made before the current rally peters out.
New Watchlist Format
Our site first began operation in October 2001. At that time we focused solely on the cup-with-handle formation and our first watchlist display page was designed for that pattern. As we added new patterns, we developed a new display for each of them and inconsistencies arose, in part because the characteristics of each pattern varies. We are conscious that this lack of consistency can be confusing to subscribers so we are moving towards a more consistent watchlist presentation style.
We have prototyped a new format and are introducing it today for the Head and Shoulders Bottom (HSB) watchlist. We are retaining the existing HSB presentation style for the time being. You'll find the new format under the Mine for Candidates > Long Positions > H & S Bottom (beta) menu choice.
For a limited time this is available to all site visitors, including guests, who can see the very latest HSB watchlist data.
We'd like your feedback on the new format and its support information (Help, Methodology, Trading Hints) so we can improve it and extend it to the other patterns. Please let us know what you think by responding to the Support Forum topic 'New Watchlist Format'. Improvements that we know we need to make are adding a filter and back testing options.
No tip this week.
| Index | Value | Change Week | Change YTD | Trend | ||||||||||||||||||||||||||||||||||||
|---|---|---|---|---|---|---|---|---|---|---|---|---|---|---|---|---|---|---|---|---|---|---|---|---|---|---|---|---|---|---|---|---|---|---|---|---|---|---|---|---|
| Dow | 8635.42 | -2.19% | -34.9% | down | ||||||||||||||||||||||||||||||||||||
| NASDAQ | 1509.31 | -1.71% | -43.09% | down | ||||||||||||||||||||||||||||||||||||
| S&P 500 | 876.07 | -2.25% | -40.34% | down | ||||||||||||||||||||||||||||||||||||
| Russell 2000 | 461.09 | -2.55% | -39.81% | down | ||||||||||||||||||||||||||||||||||||
| Wilshire 5000 | 8737.14 | -2.33% | -41.04% | down | ||||||||||||||||||||||||||||||||||||
1The Market Signal is derived from our proprietary
market model. The market model is described on the site. 2The site also shows industry rankings based on fundamentals, combined technical and fundamentals, and on price alone. The site also shows daily industry movements. |
||||||||||||||||||||||||||||||||||||||||
# of Breakouts |
Period Average1 |
Max. Gain During Period2 |
Gain at Period Close3 |
|
|---|---|---|---|---|
| This Week | 5 | 11.77 | 5.29% | 3.64% |
| Last Week | 3 | 12.23 | 7.22% | 5.96% |
| 13 Weeks | 168 | 12.62 | 14.23% |
-19.93% |
2This represents the return if each stock were bought at its breakout price and sold at its intraday high.
3This represents the return if each stock were bought at its breakout price and sold at the most recent close.
Category |
Symbol |
Company Name |
Expected Gain1 |
|---|---|---|---|
| Best Overall | TSYS | Telecommunications System | 107 |
| Top Technical | SINT | Si International | 45 |
| Top Fundamental | DV | Devry Inc | 49 |
| Top Tech. & Fund. | NCIT | NCI Inc | 59 |
Category |
Symbol |
Company Name |
Expected Gain1 |
|---|---|---|---|
| Best Overall | TSYS | Telecommunications System | 102 |
| Top Technical | TSYS | Telecommunications System | 102 |
| Top Fundamental | TSYS | Telecommunications System | 102 |
| Top Tech. & Fund. | TSYS | Telecommunications System | 102 |
If you received this newsletter from a friend and you would like to receive it regularly please go to the BreakoutWatch.com site and enter as a Guest. You will then be able to register to receive the newsletter.
Copyright © 2008 NBIcharts, LLC dba BreakoutWatch.com.
All rights reserved.
"
BreakoutWatch," the BreakoutWatch.com "eye" logo, and the
slogan "tomorrow's breakouts today" are service marks of NBIcharts
LLC. All other marks are the property of their respective owners, and are
used for descriptive purposes only.
BreakoutWatch is not affiliated with Investor's Business Daily or with Mr. William O'Neil.
Our site, research and analysis is supported entirely by subscription and is free from advertising.