| Market Summary | Weekly Breakout Report | Top Breakout Choices | Top 2nd Chances | New Features | Tip of the Week |
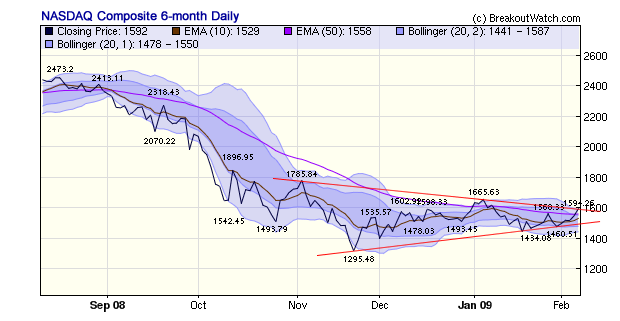
The NASDAQ is the only major index to have made positive gains this week and is also the only index to be in positive territory for the year. Last week we showed how the index was in a descending triangle, which is considered a bearish formation and this week we see the index has reached the upper bound of the triangle. It has also reached the outer 2 standard deviation Bollinger Band. This implies that the preponderance of the evidence is that the index should should turn downfrom here but with the stimulus bill certain to get passed in some form next week, and an announcement of the revised TARP plan due from Treasury Secretary Geitner on Monday, a breakout to the upside seems more likely at the time of writing.
Coincident with upturn on the NASDAQ we are seeing more breakouts and some impressive gains. The following table shows the breakouts for this week. Gains of over 10% are highlighted in yellow.
Breakout Date |
Symbol | Chart Pattern |
BoP |
Last Close |
Gain at Close |
Intraday High |
|
|---|---|---|---|---|---|---|---|
2/6/2009 |
SGR |
HTF |
29.97 |
30.25 |
0.93% |
4.04% |
|
2/6/2009 |
RMD |
CwH |
41.61 |
42.81 |
2.88% |
4.52% |
|
2/5/2009 |
HGG |
HTF |
9.18 |
10.55 |
14.92% |
15.47% |
|
2/5/2009 |
EXP |
HSB |
18.29 |
21.94 |
19.96% |
20.83% |
|
2/5/2009 |
CUB |
CwH |
29.57 |
29.56 |
−0.03% |
9.81% |
|
2/5/2009 |
AMV |
CwH |
9.51 |
9.49 |
−0.21% |
0.32% |
|
2/4/2009 |
SIAL |
HSB |
37.37 |
39.97 |
6.96% |
7.47% |
|
2/4/2009 |
FCX |
HSB |
25.6 |
29.81 |
16.45% |
19.10% |
|
2/4/2009 |
HMSY |
CwH |
32.5 |
34.29 |
5.51% |
6.06% |
|
2/4/2009 |
EW |
CwH |
58.5 |
61.1 |
4.44% |
4.62% |
|
2/4/2009 |
ALTH |
CwH |
8.23 |
8.15 |
−0.97% |
13.00% |
|
2/3/2009 |
GMCR |
CwH |
40.58 |
41.5 |
2.27% |
5.69% |
|
2/2/2009 |
ODSY |
CwH |
10.68 |
11.05 |
3.46% |
4.68% |
|
2/2/2009 |
LINC |
CwH |
15.4 |
16.35 |
6.17% |
12.27% |
|
2/2/2009 |
HAE |
CwH |
61.07 |
63.54 |
4.04% |
6.99% |
|
Average |
5.79% |
8.99% |
|||||
| Index | Value | Change Week | Change YTD | Trend | ||||||||||||||||||||||||||||||||||||
|---|---|---|---|---|---|---|---|---|---|---|---|---|---|---|---|---|---|---|---|---|---|---|---|---|---|---|---|---|---|---|---|---|---|---|---|---|---|---|---|---|
| Dow | 8280.59 | -3.7% | -5.65% | Down | ||||||||||||||||||||||||||||||||||||
| NASDAQ | 1591.71 | 1.28% | 0.93% | Down | ||||||||||||||||||||||||||||||||||||
| S&P 500 | 868.6 | -2.44% | -3.84% | Down | ||||||||||||||||||||||||||||||||||||
| Russell 2000 | 470.7 | -2.2% | -5.76% | Down | ||||||||||||||||||||||||||||||||||||
| Wilshire 5000 | 8785.09 | -2.23% | -3.32% | Down | ||||||||||||||||||||||||||||||||||||
1The Market Signal is derived from our proprietary
market model. The market model is described on the site. 2The site also shows industry rankings based on fundamentals, combined technical and fundamentals, and on price alone. The site also shows daily industry movements. |
||||||||||||||||||||||||||||||||||||||||
# of Breakouts |
Period Average1 |
Max. Gain During Period2 |
Gain at Period Close3 |
|
|---|---|---|---|---|
| This Week | 15 | 9.62 | 8.99% | 5.79% |
| Last Week | 10 | 8.92 | 14.8% | 10% |
| 13 Weeks | 121 | 10 | 16.67% |
4.58% |
2This represents the return if each stock were bought at its breakout price and sold at its intraday high.
3This represents the return if each stock were bought at its breakout price and sold at the most recent close.
Category |
Symbol |
Company Name |
Expected Gain1 |
|---|---|---|---|
| Best Overall | LAB | Labranche & Co Inc | 126 |
| Top Technical | SMG | Scotts Miracle-Gro Company | 50 |
| Top Fundamental | WES | WESTERN GAS PARTNERS | 75 |
| Top Tech. & Fund. | WES | WESTERN GAS PARTNERS | 75 |
Category |
Symbol |
Company Name |
Expected Gain1 |
|---|---|---|---|
| Best Overall | ALTH | Allos Therapeutics Inc. | 104 |
| Top Technical | CUB | Cubic Corp | 69 |
| Top Fundamental | GMCR | Green Mountain Coffee Roasters | 60 |
| Top Tech. & Fund. | GMCR | Green Mountain Coffee Roasters | 60 |
If you received this newsletter from a friend and you would like to receive it regularly please go to the BreakoutWatch.com site and enter as a Guest. You will then be able to register to receive the newsletter.
Copyright © 2009 NBIcharts, LLC dba BreakoutWatch.com.
All rights reserved.
"
BreakoutWatch," the BreakoutWatch.com "eye" logo, and the
slogan "tomorrow's breakouts today" are service marks of NBIcharts
LLC. All other marks are the property of their respective owners, and are
used for descriptive purposes only.
BreakoutWatch is not affiliated with Investor's Business Daily or with Mr. William O'Neil.
Our site, research and analysis is supported entirely by subscription and is free from advertising.