| Market Summary | Weekly Breakout Report | Top Breakout Choices | Top 2nd Chances | New Features | Tip of the Week |
Our newsletter this week is devoted to introducing a new service that we are very excited about because backtesting on historical breakout data has shown the service to be extremely profitable. Backtesting has shown an annual compound return of 90% is possible. This week we show you how that is possible and, as usual, provide complete transparancy in our results. We hardly believe these results ourselves and willingly invite your participation in strategy testing so we can be sure they are real.
The heart of the new service is a partnership with Zacks Investment Research to bring you a new watchlist of stocks that are ranked 'Strong Buy' by Zacks and are also on one of our other chart patterns. This allows you to time your entry into these 'strong buy' stocks as they break out.
Why should we be interested in Zack's Strong Buy Stocks?
We already know the importance of Current and Annual earnings in stock valuations but one of the most important influences on a stock's price is anticipated future earnings. On page 11 of O'Neil's How to Make Money in Stocks, third edition, we read "be sure to check the consensus earnings estimates of a large group of analysts for the next several quarters .. to make sure the company is projected to be on a positive track". Zack's research does that work for us and ranks stocks on a scale of 1 - 5. Stocks ranked 1 are those that have had recent upwards earnings revisions and are rated 'strong buy'.
Confirmation of the importance of earnings revisions is also provided by the AAII. In their April, 2009 Journal they write "changes in earnings expectations, no matter how slight, can have a significant impact on a stock's price - the effects can be felt for as long as a year".
We thought it would be interesting to see if choosing breakouts on the basis of recent earnings revisions was a winning strategy and were stunned by the potential our backtesting showed. Using a simple portfolio management strategy we were able to generate exceptional returns. That strategy and a tool for you to use to confirm the results is described below in our Top Tip section. But first we explain the new service.
New Service - Zack's Strong Buy Watchlist with Buy and Sell Alerts
The Zacks Strong Buy watchlist is a list of stocks that are currently ranked as 'Strong Buy' by Zacks Investment Research and are also listed on one of our long position watchlists. Zacks updates their list of strong buys daily based on earnings revisions and our list of Zacks Strong Buy candidates is refreshed daily also. The Zacks Strong Buy watchclist therefore contains the very latest earnings revisions candidates. Our research shows that an investment strategy of combining breakouts and earnings revisions gives exceptional returns over time using our recommended portfolio management strategy (see below).
The Zacks Strong Buy Watchlist is accessed from the Mine for Candidates > ZacksStrong Buy menu choice. This week we introduce the watchlist and next week we will introduce a new report of stocks that attempted to break out from the watchlist, but are no longer rated 'Strong Buy'. At that time we will also introduce email alerts for Zacks Strong Buy breakouts and email alerts for those no longer rated 'strong buy'. Normally, email alerts are only sent to Gold and Platinum subscribers but for a limited time, this service will be available to Silver subscribers also.
Because the Zacks 'Strong Buy' rank is proprietary to Zacks you must have a Zacks Premium account to access this list. You can get a 30-day free trial from Zacks Investment Research by clicking the Zacks logo:
![]()
A Simple Portfolio Management Strategy using the Zacks Strong Buy Watchlist
The strategy we present here has back tested to give exceptional returns since 2004 - the earliest date for which we have reliable breakout data. The results are:
| Strategy Results 2004 - 2009 - Buy on Alert | ||||||||
|---|---|---|---|---|---|---|---|---|
Year |
2004 | 2005 | 2006 | 2007 | 2008 | 2009 | Compound 2004 - 2009 | |
| Strategy | S&P 500 | |||||||
Initial Portfolio Value |
$10,000.00 | $10,000.00 | $10,000.00 | $10,000.00 | $10,000.00 | $10,000.00 | $10,000.00 | $10,000.00 |
Final Portfolio Value |
$17,324.46 | $16,952.34 | $20,750.49 | $26,845.52 | $16,283.16 | $12,021.10 | $308,729.14 | $8,084.33 |
Gain/Loss % |
73.24 % | 69.52 % | 107.5 % | 168.46 % | 62.83 % | 20.21 % | 2987.29 % | -19.16 % |
Avg. premium paid over breakout price |
0.67 % | 0.71 % | 0.79 % | 0.96 % | 0.88 % | 1.59 % | 0.86 % | N/A |
Maximum Portfolio Value |
$17,358.80 | $17,489.20 | $20,750.49 | $28,260.19 | $16,369.36 | $12,126.01 | $311,406.25 | $3,946.91 |
Maximum Gain % |
73.59 % | 74.89 % | 107.5 % | 182.6 % | 63.69 % | 21.26 % | 3014.06 % | 39.47 % |
Compound Annual Return % |
74.3 % | 70.02 % | 108.34 % | 169.92 % | 62.83 % | 72.68 % | 90.28 % | -3.91 % |
Minimum Portfolio Value |
$10,000.00 | $9,766.22 | $10,000.00 | $9,994.15 | $9,646.34 | $9,898.48 | $10,000.00 | $6,028.50 |
Maximum Loss % |
0 % | -2.34 % | 0 % | -0.06 % | -3.54 % | -1.02 % | 0 % | -39.72 % |
Maximum Drawdown |
$1,153.29 | $1,720.40 | $2,319.40 | $1,823.78 | $2,137.58 | $1,082.36 | $35,400.34 | $7,918.41 |
Maximum Drawdown % |
6.92 % | 14.98 % | 14.31 % | 6.47 % | 14.04 % | 9.49 % | 14.04 % | 56.78 % |
Maximum Positions Filled |
5 | 5 | 5 | 5 | 5 | 5 | 5 | N/A |
No. of wins |
24 | 29 | 29 | 45 | 25 | 11 | 173 | N/A |
Avg. win % |
12.12 % | 11.83 % | 14.21 % | 13.18 % | 13.8 % | 11.48 % | 14.25 % | N/A |
No. of losses |
18 | 22 | 24 | 19 | 30 | 11 | 106 | N/A |
.. of which stopped out count |
11 | 10 | 14 | 11 | 17 | 6 | 69 | N/A |
Avg. Loss % |
-4.25 % | -4.11 % | -4.79 % | -3.45 % | -4.67 % | -3.16 % | -5.38 % | N/A |
Win/Loss Ratio |
1.33 | 1.32 | 1.21 | 2.37 | 0.83 | 1 | 1.63 | N/A |
Avg. Return per Trade |
5.1 % | 4.96 % | 5.6 % | 8.24 % | 3.73 % | 4.16 % | 6.79 % | N/A |
Avg. Days Held |
27.83 | 23.31 | 27.36 | 18.08 | 21.33 | 16.77 | 22.81 | N/A |
Max. Consecutive Wins |
6 | 12 | 9 | 12 | 7 | 5 | 12 | N/A |
Max. Consecutive Losses |
3 | 4 | 4 | 4 | 5 | 3 | 9 | N/A |
Chart of Compound Strategy Returns 2004-2009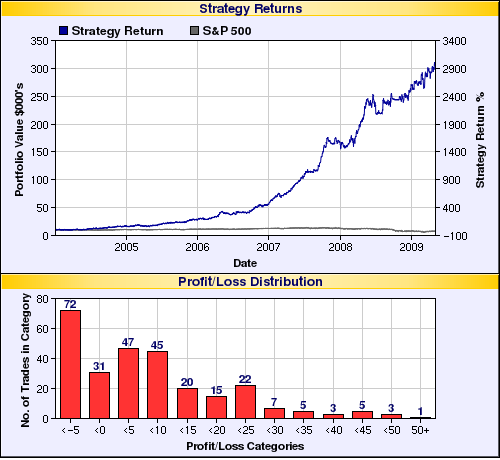
Our trading strategy is purely mechanical and extremely simple. As a result it is easy to implement for the private investor. The strategy's strengths are:
- only two buy rules and two sell rules.
- parameter values are robust and constant over all time frames and market conditions
- the choice of number of simultaneous positions open is at your discretion
- the strategy uses risk control levels that you determine depending on your risk tolerance
- the money management rule is powerful but extremely simple
Buy Rules:
- For subscribers able to act on email alerts: buy as soon as you receive the alert
- For others: buy at next session's open. (note: After an alert, these stocks move up quickly and buying at the open can mean paying a significant premium over the alert price with a consequent loss of profits. The premium paid is shown in the simulation results).
Sell Rules
- Sell at next open if it is no longer ranked #1 on Zacks rank.
- Sell at following day's open if it closes below a stop loss level of your choice at any time after breakout and before losing the Zacks #1 ranking.
Parameter Values
- Stop Loss level as a % of breakout price. For example 7% would limit loss to 7% of initial position value.
- Buy Limit as % of breakout price to minimize premium paid over breakout price
- Buy Stop as % of breakout price to allow buying if open is below breakout price.
- Number of positions - maximum number of positions to hold at any one time.
- Minimum volume of your choice.
- Minimum RS Rank of your choice.
Money Management
- On buy, invest 1/n th value of available cash where n is the number of open positions. For example, if your maximum positions is 5 and you hold three stocks in your portfolio, on the next breakout you would invest 1/2 of your available cash as you have two positions open.
- On sell, add proceeds to your available cash. This allows compounding of your gains as your position size will grow as your portfolio grows. On a loss, your next investment will be smaller thereby conserving your capital.
You can simulate the strategy using a backtest toll we have developed.
Zacks Breakout Strategy Backtest Tool
This simulation allows you to test various parameter values. You can see the trades that would be made and the daily portfolio value by clicking the 'View Transaction Data' button which you can then copy and paste into a spreadsheet. We suggest using the default values first.
Note: only stocks with a minimum price of $6, minimum avg. volume of 30,000 and RS Rank >= 80 are considered.
The simulation considers stocks ranked #1 as of Monday morning and looks for breakouts in the subsequent 5 days. While a #1 ranked stock will be bought on breakout, a stock losing its its #1 rank is not sold until the Monday following the week in which it lost its rank. This potentially reduces the simulated gain or increases the simulated loss. The simulation uses realistic buy and sell prices, but does not account for slippage, commissions, taxes, etc.
| Index | Value | Change Week | Change YTD | Trend | ||||||||||||||||||||||||||||||||||||
|---|---|---|---|---|---|---|---|---|---|---|---|---|---|---|---|---|---|---|---|---|---|---|---|---|---|---|---|---|---|---|---|---|---|---|---|---|---|---|---|---|
| Dow | 8268.64 | -3.57% | -5.79% | Down | ||||||||||||||||||||||||||||||||||||
| NASDAQ | 1680.14 | -3.38% | 6.54% | Up | ||||||||||||||||||||||||||||||||||||
| S&P 500 | 882.88 | -4.99% | -2.26% | Down | ||||||||||||||||||||||||||||||||||||
| Russell 2000 | 475.84 | -7.03% | -4.73% | Up | ||||||||||||||||||||||||||||||||||||
| Wilshire 5000 | 9004.41 | -5.31% | -0.91% | Down | ||||||||||||||||||||||||||||||||||||
1The Market Signal is derived from our proprietary
market model. The market model is described on the site. 2The site also shows industry rankings based on fundamentals, combined technical and fundamentals, and on price alone. The site also shows daily industry movements. |
||||||||||||||||||||||||||||||||||||||||
# of Breakouts |
Period Average1 |
Max. Gain During Period2 |
Gain at Period Close3 |
|
|---|---|---|---|---|
| This Week | 6 | 12.92 | 14.27% | 2.9% |
| Last Week | 32 | 12.54 | 12.93% | -3.99% |
| 13 Weeks | 159 | 13.46 | 21.79% |
5.04% |
2This represents the return if each stock were bought at its breakout price and sold at its intraday high.
3This represents the return if each stock were bought at its breakout price and sold at the most recent close.
Category |
Symbol |
Company Name |
Expected Gain1 |
|---|---|---|---|
| Best Overall | HTGC | Hercules Technology Growth Capital Inc | 117 |
| Top Technical | EC | Engelhard Corp | 57 |
| Top Fundamental | ICUI | Icu Medical Inc | 49 |
| Top Tech. & Fund. | ICUI | Icu Medical Inc | 49 |
Category |
Symbol |
Company Name |
Expected Gain1 |
|---|---|---|---|
| No stocks in buyable range. | |||
If you received this newsletter from a friend and you would like to receive it regularly please go to the BreakoutWatch.com site and enter as a Guest. You will then be able to register to receive the newsletter.
Copyright © 2009 NBIcharts, LLC dba BreakoutWatch.com.
All rights reserved.
"
BreakoutWatch," the BreakoutWatch.com "eye" logo, and the
slogan "tomorrow's breakouts today" are service marks of NBIcharts
LLC. All other marks are the property of their respective owners, and are
used for descriptive purposes only.
BreakoutWatch is not affiliated with Investor's Business Daily or with Mr. William O'Neil.
Our site, research and analysis is supported entirely by subscription and is free from advertising.