| Market Summary | Weekly Breakout Report | Top Breakout Choices | Top 2nd Chances | New Features | Tip of the Week |
The major indexes continue to trend upwards but on light volume implying investors are cautious about committing further funds until a new trend is confirmed. The DJI is at last positive for the year and the year's leader, the NASDAQ Composite, seems ready to consolidate its recent gains with a small pullback. The NASDAQ chart shows it has pulled back from riding the upper Bollinger Band higher and has taken a more neutral position heading toward the center of the band.
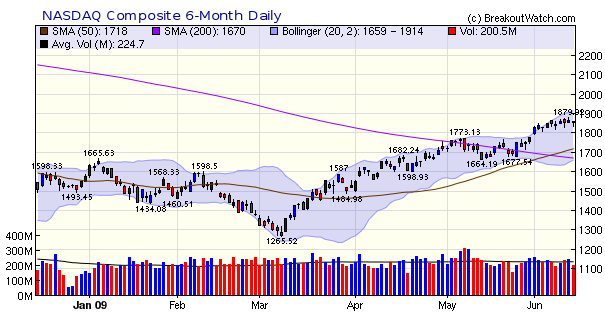
The number of breakouts has also retreated as volume has fallen. Since a jump in volume is necessary to confirm a breakout, it follows that lower volume means fewer breakout attempts and consequently fewer breakouts. We can expect that the number of breakouts will again increase after this short period of consolidation is over.
Since introducing the Zacks Strong Buy Strategy we have been puzzled by one of the results of the backtest which is that simulations with just one position outperform the others. We wrongly attributed this effect to the sequence in which buys and sells are made on the assumption that it was a historical accident that there were more positive results than negative results in the data sequence. We are now delighted to be able to explain this phenomena and show that using one position for this strategy can produce significantly superior returns to using multiple positions.
The reason is that with one position, more of our capital is working for us than with multiple positions. This arises because of the sparseness of the Zacks Strong Buy breakouts. With one position we commit 100% of our available capital to each buy but with two or more positions we are diluting the amount committed to each position. Because the breakouts can be several days apart, a proportion of our capital can be idle for several days.
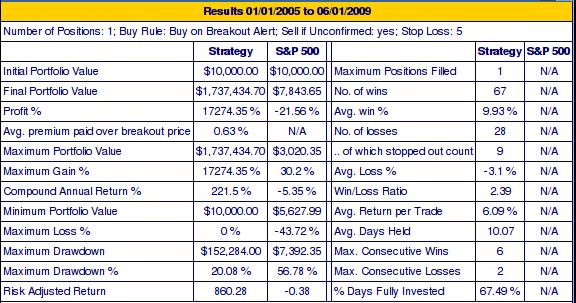
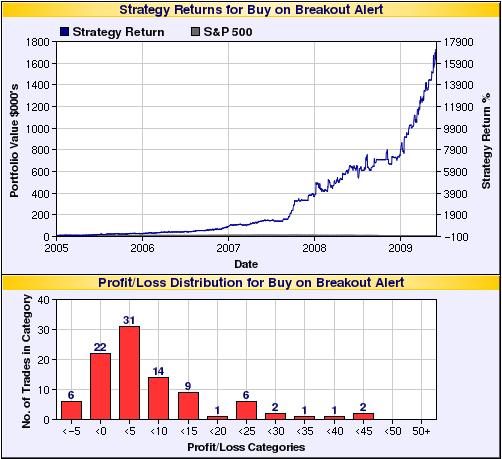
To demonstrate this we have added a new line to our backtest simulation tool which shows the percent number of days our capital is working for us ('% Days Fully Invested' in the last cell of the redesigned results display) . Try this simple test for yourself: run the simulation from 1 January 2009 to June 1, 2009 with one position and then two (using the default options). You will see that with one position, we were fully invested 65.6% of the time while with two positions we were fully invested just 44.4% of the time. The result is that with one position we earned a profit 116% profit (not bad for 2009!!!) but with two positions we only earned a 45.8% profit. Now look at the transaction data for each scenario and follow through the buys, sells and amounts committed to each position and you will understand why having more capital working for you gives better results. Now run with five positions and you will see that our capital was working for us only 4.6% of the time and our profit is reduced to 18.6%.
The sequence in which the trades were made and the profits they earned do influence the simulation results and we would not rely on a simulation for 2009 alone. So we suggest you now run from January 2004 until June 1, 2009 with one position. You will see that we were fully invested 69.2% of the time for an annualized compound return of 194%. Compare that to five positions where we are fully invested just 11.5% of the time for a compound annual return of 102%.
The better return for one position is achieved at greater risk, however. The maximum drawdown was 20.1% compared to 7.2% with the five position option. With more of our capital committed at any time we have more at risk so the drawdown increases. We leave it to you to decide which reward to risk ratio you prefer.
The results for one position from 2004 to June, 2009 are shown here.
| Index | Value | Change Week | Change YTD | Trend | ||||||||||||||||||||||||||||||||||||
|---|---|---|---|---|---|---|---|---|---|---|---|---|---|---|---|---|---|---|---|---|---|---|---|---|---|---|---|---|---|---|---|---|---|---|---|---|---|---|---|---|
| Dow | 8799.26 | 0.41% | 0.26% | Down | ||||||||||||||||||||||||||||||||||||
| NASDAQ | 1858.8 | 0.51% | 17.87% | Up | ||||||||||||||||||||||||||||||||||||
| S&P 500 | 946.21 | 0.65% | 4.76% | Down | ||||||||||||||||||||||||||||||||||||
| Russell 2000 | 526.84 | -0.66% | 5.48% | Up | ||||||||||||||||||||||||||||||||||||
| Wilshire 5000 | 9701.14 | 0.48% | 6.76% | Down | ||||||||||||||||||||||||||||||||||||
1The Market Signal is derived from our proprietary
market model. The market model is described on the site. 2The site also shows industry rankings based on fundamentals, combined technical and fundamentals, and on price alone. The site also shows daily industry movements. |
||||||||||||||||||||||||||||||||||||||||
# of Breakouts |
Period Average1 |
Max. Gain During Period2 |
Gain at Period Close3 |
|
|---|---|---|---|---|
| This Week | 11 | 16.62 | 6.4% | 0.92% |
| Last Week | 22 | 16.38 | 15.25% | 7.97% |
| 13 Weeks | 209 | 17.15 | 22.34% |
9.86% |
2This represents the return if each stock were bought at its breakout price and sold at its intraday high.
3This represents the return if each stock were bought at its breakout price and sold at the most recent close.
Category |
Symbol |
Company Name |
Expected Gain1 |
|---|---|---|---|
| Best Overall | HTGC | Hercules Technology Growth Capital Inc | 119 |
| Top Technical | BKR | Michael Baker Corp | 57 |
| Top Fundamental | RGR | Sturm Ruger & Co Inc | 72 |
| Top Tech. & Fund. | RGR | Sturm Ruger & Co Inc | 72 |
Category |
Symbol |
Company Name |
Expected Gain1 |
|---|---|---|---|
| Best Overall | MDCI | Medical Action Ind Inc | 91 |
| Top Technical | MDCI | Medical Action Ind Inc | 91 |
| Top Fundamental | MDCI | Medical Action Ind Inc | 91 |
| Top Tech. & Fund. | MDCI | Medical Action Ind Inc | 91 |
If you received this newsletter from a friend and you would like to receive it regularly please go to the BreakoutWatch.com site and enter as a Guest. You will then be able to register to receive the newsletter.
Copyright © 2009 NBIcharts, LLC dba BreakoutWatch.com.
All rights reserved.
"
BreakoutWatch," the BreakoutWatch.com "eye" logo, and the
slogan "tomorrow's breakouts today" are service marks of NBIcharts
LLC. All other marks are the property of their respective owners, and are
used for descriptive purposes only.
BreakoutWatch is not affiliated with Investor's Business Daily or with Mr. William O'Neil.
Our site, research and analysis is supported entirely by subscription and is free from advertising.