| Market Summary | Weekly Breakout Report | Top Breakout Choices | Top 2nd Chances | New Features | Tip of the Week |
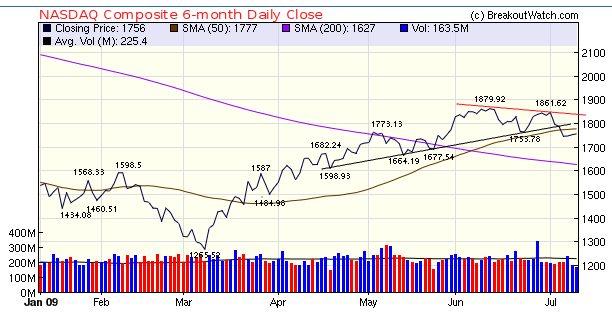
On Wednesday our market trend indicator for the Russell 2000 turned downward leaving only the NASDAQ Composite in an upward trend. That looks at risk though as the index has fallen below its 50 day moving average and its trend line support. With investors seriously worried that earnings will not meet expectations, despite a better than expected performance by Alcoa, we will likely see further declines unless the expectation of weaker than expected earnings is reversed and the forward looking statements are more positive.
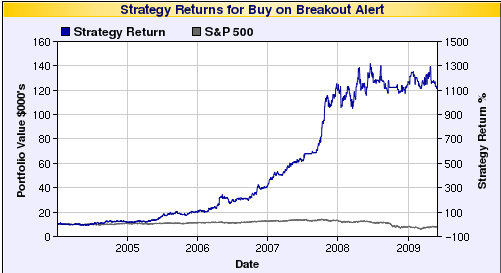
Revised ZSB Results Deliver over 60% Compound Annual Returns
Our ZSB backtest tool uses a combination of our record of historical breakout price for each symbol and chart pattern, the corresponding alert prices and our price history database. When a stock splits, we adjust the historical prices by the split factor to avoid data discontinuities, and we also adjust the breakout prices so they will be consistent with the price history. Until we developed the ZSB backtest, we had not found it necessary to adjust the alert prices for splits, however. The code we developed to adjust the alert price was buggy and under some circumstances it adjusted the alert price to be lower than it should have been. This had the effect of increasing the profit (and minimizing the loss) on some simulated trades. Through the power of compounding this caused the backtest tool to report truly exceptional returns.
The data has now been corrected and although the backtest now gives lower returns than before, the returns are still exceptional when compared to the market indexes and mutual fund performance over the last 5 years.
The backtest tool allows you to test three scenarios:
- Buy at open when a breakout is confirmed.
- Buy on breakout alert and sell at next open if breakout is not confirmed else hold until stop loss is met or the stock loses the Zack's strong buy rating
- Buy on breakout alert and hold until stop loss is met or the stock loses the Zack's strong buy rating
We ran the backtest tool for these three scenarios using all possible combinations of stop loss and portfolio positions for the cup-with-handle watchlist and found the best returns were:
Strategy |
Compound Ann. Return % |
Max. Drawdown % |
Stop Loss % |
Positions |
|
|---|---|---|---|---|---|
| 1. Buy on Confirmed Breakout |
|||||
1.1 Best Overall Return |
27.8 |
37.5 |
8 |
1 |
|
1.2 Best Reward/Risk |
17.7 |
11.5 |
3 |
1 |
|
2. Buy on Alert, Sell if Unconfirmed |
|||||
2.1 Best Overall Return |
61.4 |
30.4 |
2 |
1 |
|
2.2 Best Reward/Risk |
61.4 |
30.4 |
2 |
1 |
|
3. Buy on Alert, Keep if unconfirmed |
|||||
3.1 Best Overall Return |
67.6 |
31.2 |
3 |
1 |
|
3.2 Best Reward/Risk |
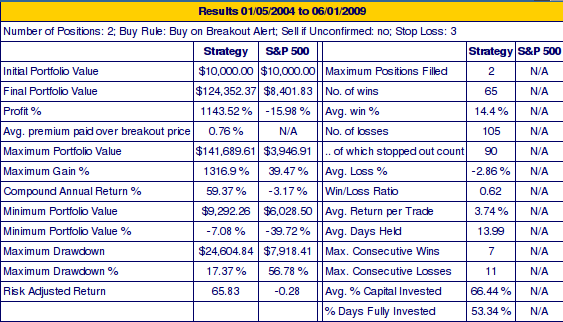
59.37 |
17.4 |
3 |
2 |
|
Note that the best returns are mostly when you allocate all your portfolio to a single position. This is because more of your money is invested at any one time, whereas with two or more positions there will be times when you are invested only partially and you are not maximizing your return.
For any trading (or betting) system, the participant must have the temperament (and resources) to withstand a succession of losses and the potential for a large drawdown. For this reason, we personally prefer scenario number 3.2 with the 3% stop loss and 2 position option. However, one can argue that the large drawdown was exceptional in all cases due to the biggest market decline since the 1930's and such large drawdowns are unlikely to be repeated in the next few years. If so, you can choose option 3.2.
Here are the detailed results for option 3.2. You can verify them and run other scenarios with the ZSB Backtest Tool, which is freely available to all.
| Index | Value | Change Week | Change YTD | Trend | ||||||||||||||||||||||||||||||||||||
|---|---|---|---|---|---|---|---|---|---|---|---|---|---|---|---|---|---|---|---|---|---|---|---|---|---|---|---|---|---|---|---|---|---|---|---|---|---|---|---|---|
| Dow | 8146.52 | -1.62% | -7.18% | Down | ||||||||||||||||||||||||||||||||||||
| NASDAQ | 1756.03 | -2.25% | 11.35% | Up | ||||||||||||||||||||||||||||||||||||
| S&P 500 | 879.13 | -1.93% | -2.67% | Down | ||||||||||||||||||||||||||||||||||||
| Russell 2000 | 480.98 | -3.52% | -3.7% | Down | ||||||||||||||||||||||||||||||||||||
| Wilshire 5000 | 9000.28 | -2.18% | -0.96% | Down | ||||||||||||||||||||||||||||||||||||
1The Market Signal is derived from our proprietary
market model. The market model is described on the site. 2The site also shows industry rankings based on fundamentals, combined technical and fundamentals, and on price alone. The site also shows daily industry movements. |
||||||||||||||||||||||||||||||||||||||||
# of Breakouts |
Period Average1 |
Max. Gain During Period2 |
Gain at Period Close3 |
|
|---|---|---|---|---|
| This Week | 7 | 14.69 | 5.07% | 1.68% |
| Last Week | 4 | 15.69 | 6.95% | -5.85% |
| 13 Weeks | 191 | 16 | 19.97% |
-2.15% |
2This represents the return if each stock were bought at its breakout price and sold at its intraday high.
3This represents the return if each stock were bought at its breakout price and sold at the most recent close.
Category |
Symbol |
Company Name |
Expected Gain1 |
|---|---|---|---|
| Best Overall | AER | AERCAP HOLDINGS N.V. | 110 |
| Top Technical | FSC | FIFTH STREET FINANCE | 83 |
| Top Fundamental | RGR | Sturm Ruger & Co Inc | 71 |
| Top Tech. & Fund. | IPCM | IPC HOSPITALIST CO | 60 |
Category |
Symbol |
Company Name |
Expected Gain1 |
|---|---|---|---|
| Best Overall | TRW | Trw Automotive Hldgs Corp | 96 |
| Top Technical | TPP | Teppco Partners (L.P.) | 61 |
| Top Fundamental | ORLY | O'reilly Automotive Inc | 51 |
| Top Tech. & Fund. | ORLY | O'reilly Automotive Inc | 51 |
If you received this newsletter from a friend and you would like to receive it regularly please go to the BreakoutWatch.com site and enter as a Guest. You will then be able to register to receive the newsletter.
Copyright © 2009 NBIcharts, LLC dba BreakoutWatch.com.
All rights reserved.
"
BreakoutWatch," the BreakoutWatch.com "eye" logo, and the
slogan "tomorrow's breakouts today" are service marks of NBIcharts
LLC. All other marks are the property of their respective owners, and are
used for descriptive purposes only.
BreakoutWatch is not affiliated with Investor's Business Daily or with Mr. William O'Neil.
Our site, research and analysis is supported entirely by subscription and is free from advertising.