| Market Summary | Weekly Breakout Report | Top Breakout Choices | Top 2nd Chances | New Features | Tip of the Week |
The markets have rallied over the last few weeks as earnings have beaten expectations. Bloomberg reports that "more than three out of four companies in the S&P 500 that released results since June 17 exceeded earnings projections for the second quarter. They’ve beaten forecasts by an average 10 percent, even as per-share earnings tumbled 32 percent and sales slid 16 percent".
Can this rally be sustained? As earnings season slows, the market continues to improve as a number of factors point towards a slowing of the rate of contraction of the economy. The markets are forward looking so they are anticipating that as we contract more slowly the rate of contraction will soon reach zero and expansion will then begin. The signs are certainly positive. Stimulus spending seems to be replacing what was lost by consumer spending and this should translate eventually into a decline in the unemployment rate. As evidence of the stimulus starting to we work it is notable that our best performing industry this week is auto-dealerships as consumers rush to buy vehicles partly financed by the 'cash for clunkers' program.
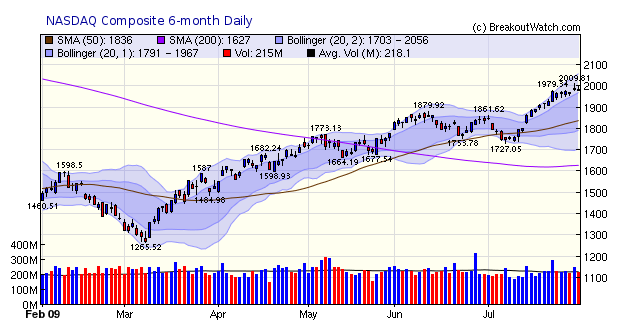
If the rally is sustained, it will be technology that benefits primarily as investment is made in new productivity tools. Companies prefer to invest first in technology to improve productivity rather than people so we can expect the NASDAQ Composite and technology firms in particular to be leaders in the coming months.
In the short term though we expect the NASDAQ to mark time until the gains of the last months are justified by results. The chart shows that a run up along the uppermost Bollinger Band may be ending. We often see that as the bands widen there is an 'elastic band' effect that eventually pulls them closer and we could be seeing the beginning of that effect now. If so, the use of tight stops becomes more important.
Breakouts with High RS Rank Outperform the Rest
Each of our long position watchlists contains a Filter Settings tab which allows you to set filters to limit the alerts you receive to only those stocks that match your filter settings.
Naturally, you only want to receive alerts on stocks that have the best potential return, so how do you set the filters? To answer this question we provide a backtest tool which allows you to see which breakouts have outperformed all breakouts over whatever period you choose, up to 365 days.
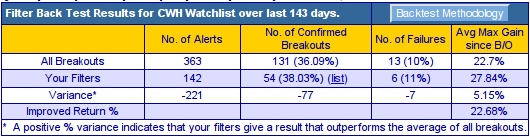
We wanted to see which cup-with-handle breakouts had performed best since March 9 so we wrote a little algorithm to run the backtest over multiple filter combinations. We found that the best returns were given by breakouts with an RS Rank of 91 or more and a minimum daily volume of 40,000 shares. This combination beat the return for all breakouts by 22.7%. Here is our results table:
Filter settings: RS Rank >= 91;BoV>=40k |
 |
In other words, values for technical score, fundamental score, industry rank and breakout price were not significant factors in selecting profitable breakouts from all breakouts. For some subscribers this may seem counter intuitive as they might think that stocks with a high fundamental or high technical score would perform better. In fact requiring a strong fundamental score severely limits the return. Here is the result with a minimum fundamental score of 4.
Filter Settings: Fundamental Score >= 4 |
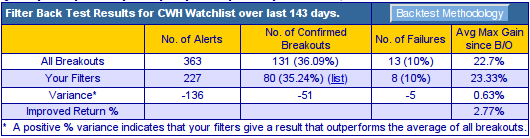 |
So filtering on fundamental score does improve returns, but only slightly.
Over the years, we have found that different filter values yield different results. Platinum subscribers have access to filters and the backtest tool so they can continuously refine what is working in the current market
| Index | Value | Change Week | Change YTD | Trend | ||||||||||||||||||||||||||||||||||||
|---|---|---|---|---|---|---|---|---|---|---|---|---|---|---|---|---|---|---|---|---|---|---|---|---|---|---|---|---|---|---|---|---|---|---|---|---|---|---|---|---|
| Dow | 9171.61 | 0.86% | 4.5% | Down | ||||||||||||||||||||||||||||||||||||
| NASDAQ | 1978.5 | 0.64% | 25.46% | Up | ||||||||||||||||||||||||||||||||||||
| S&P 500 | 987.48 | 0.84% | 9.33% | Down | ||||||||||||||||||||||||||||||||||||
| Russell 2000 | 556.71 | 1.5% | 11.46% | Up | ||||||||||||||||||||||||||||||||||||
| Wilshire 5000 | 10147 | 0.85% | 11.66% | Down | ||||||||||||||||||||||||||||||||||||
1The Market Signal is derived from our proprietary
market model. The market model is described on the site.
2The site also shows industry rankings based on fundamentals, combined technical and fundamentals, and on price alone. The site also shows daily industry movements. |
||||||||||||||||||||||||||||||||||||||||
|
# of Breakouts
|
Period Average1
|
Max. Gain During Period2
|
Gain at Period Close3
|
|
|---|---|---|---|---|
| This Week | 16 | 15.77 | 10.56% | 4.55% |
| Last Week | 19 | 16.15 | 13.26% | 8.68% |
| 13 Weeks | 197 | 17.38 | 22.19% |
11.59% |
2This represents the return if each stock were bought at its breakout price and sold at its intraday high.
3This represents the return if each stock were bought at its breakout price and sold at the most recent close.
|
Category
|
Symbol
|
Company Name
|
Expected Gain1
|
|---|---|---|---|
| Best Overall | FEED | AGFEED INDUSTRIES | 128 |
| Top Technical | GPRE | Green Plains Renewable Energy | 119 |
| Top Fundamental | TNDM | Neutral Tandem | 67 |
| Top Tech. & Fund. | TNDM | Neutral Tandem | 67 |
|
Category
|
Symbol
|
Company Name
|
Expected Gain1
|
|---|---|---|---|
| Best Overall | NJ | Nidec Corp Adr | 61 |
| Top Technical | LZ | Lubrizol Corp | 60 |
| Top Fundamental | CMG | Chipotle Mexican Grill | 45 |
| Top Tech. & Fund. | CMG | Chipotle Mexican Grill | 45 |
If you received this newsletter from a friend and you would like to receive it regularly please go to the BreakoutWatch.com site and enter as a Guest. You will then be able to register to receive the newsletter.
Copyright © 2009 NBIcharts, LLC dba BreakoutWatch.com. All rights
reserved.
" BreakoutWatch," the BreakoutWatch.com "eye" logo, and the slogan
"tomorrow's breakouts today" are service marks of NBIcharts LLC. All
other marks are the property of their respective owners, and are used
for descriptive purposes only.
BreakoutWatch is not affiliated with Investor's Business Daily or
with Mr. William O'Neil. Our site, research and analysis is supported
entirely by subscription and is free from advertising.