| Market Summary | Weekly Breakout Report | Top Breakout Choices | Top 2nd Chances | New Features | Tip of the Week |
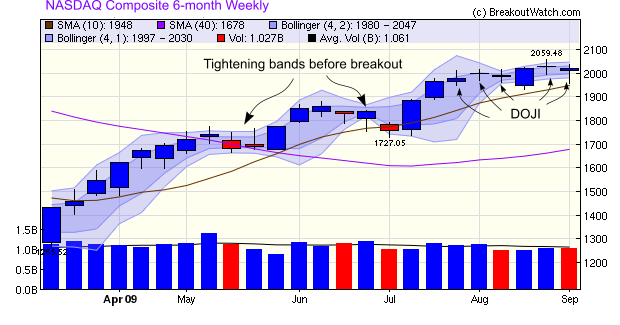
This week we'll analyze the NASDAQ Composite weekly chart as there are a number of interesting features. Also, it is on the NASDAQ Exchange that we expect the majority of stock breakouts. The chart shows the index found support at the 50 day moving average level this week after it looked as though investors were losing confidence that the rally could be sustained. The chart also shows the indecision present in the market for several weeks now. The 'Doji' pattern this week and in five of the last six weeks is indicative of a market looking for direction to the up- and down-side and not finding it.
Another feature of the chart is the tightening Bollinger Bands. The bands tighten as the daily trading range becomes less volatile and this is often a precursor to a breakout either to the up or downside.
Overall, the bias remains to the upside and as long as the economic news continues to improve, then we can expect that to continue, although at a slower pace than the last six months.
We wish our newsletter subscribers a happy and safe Labor Day weekend.
We wondered what the result would be if we applied the same buy strategy to our cup-with-handle list.
To compare the effects of buying on alert we looked at the highest intraday high reached for breakouts from the ZSB and CWH lists since March 9, when the market hit bottom.
We found that of the 57 alerts from the ZSB list (including our backtest data) the average gain to intraday high was 26.7% while the average gain to intraday high for CWH alerts, of which there were 313, was 23.4%
After running a Student's t-test to see if the difference in the means was statistically significant, we found that the probability that the results were equivalent was just 0.33. This means that there was a meaningful difference in profits gained from the Zacks Strong Buy alerts.
This result shows that alerts from the Zacks Strong Buy list perform significantly better, on average, than alerts from the cup with handle list. Since most of the ZSB alerts are also cup-with-handle alerts, it follows that the ZSB list is a useful filter for CWH alerts.
To receive alerts from the ZSB list you must be a subscriber to the Zacks Premium service. You can get a 30 day free trial from Zacks by clicking their logo:
| Index | Value | Change Week | Change YTD | Trend | ||||||||||||||||||||||||||||||||||||
|---|---|---|---|---|---|---|---|---|---|---|---|---|---|---|---|---|---|---|---|---|---|---|---|---|---|---|---|---|---|---|---|---|---|---|---|---|---|---|---|---|
| Dow | 9441.27 | -1.08% | 7.58% | Down | ||||||||||||||||||||||||||||||||||||
| NASDAQ | 2018.78 | -0.49% | 28.01% | Up | ||||||||||||||||||||||||||||||||||||
| S&P 500 | 1016.4 | -1.22% | 12.53% | Up | ||||||||||||||||||||||||||||||||||||
| Russell 2000 | 570.5 | -1.61% | 14.23% | Up | ||||||||||||||||||||||||||||||||||||
| Wilshire 5000 | 10451.5 | -1.21% | 15.01% | Up | ||||||||||||||||||||||||||||||||||||
1The Market Signal is derived from our proprietary
market model. The market model is described on the site. 2The site also shows industry rankings based on fundamentals, combined technical and fundamentals, and on price alone. The site also shows daily industry movements. |
||||||||||||||||||||||||||||||||||||||||
# of Breakouts |
Period Average1 |
Max. Gain During Period2 |
Gain at Period Close3 |
|
|---|---|---|---|---|
| This Week | 4 | 10.77 | 12.67% | 6.21% |
| Last Week | 9 | 12.92 | 10.25% | 1.12% |
| 13 Weeks | 141 | 13.31 | 22.19% |
8.73% |
2This represents the return if each stock were bought at its breakout price and sold at its intraday high.
3This represents the return if each stock were bought at its breakout price and sold at the most recent close.
Category |
Symbol |
Company Name |
Expected Gain1 |
|---|---|---|---|
| Best Overall | TLB | Talbots Inc | 119 |
| Top Technical | MSSR | McCormick & Schmicks Seafood | 89 |
| Top Fundamental | OII | Oceaneering Internat | 57 |
| Top Tech. & Fund. | OII | Oceaneering Internat | 57 |
Category |
Symbol |
Company Name |
Expected Gain1 |
|---|---|---|---|
| Best Overall | CDE | Coeur D'alene Mines Corp | 70 |
| Top Technical | CDE | Coeur D'alene Mines Corp | 70 |
| Top Fundamental | CDE | Coeur D'alene Mines Corp | 70 |
| Top Tech. & Fund. | CDE | Coeur D'alene Mines Corp | 70 |
If you received this newsletter from a friend and you would like to receive it regularly please go to the BreakoutWatch.com site and enter as a Guest. You will then be able to register to receive the newsletter.
Copyright © 2009 NBIcharts, LLC dba BreakoutWatch.com.
All rights reserved.
"
BreakoutWatch," the BreakoutWatch.com "eye" logo, and the
slogan "tomorrow's breakouts today" are service marks of NBIcharts
LLC. All other marks are the property of their respective owners, and are
used for descriptive purposes only.
BreakoutWatch is not affiliated with Investor's Business Daily or with Mr. William O'Neil.
Our site, research and analysis is supported entirely by subscription and is free from advertising.