| Market Summary | Weekly Breakout Report | Top Breakout Choices | Top 2nd Chances | New Features | Tip of the Week |
The market continues to trend higher but at a slower pace. Our equivolume chart of the NASDAQ Composite shows that the index set a new intraday high for the year on Thursday and met resistance at that level on Friday. The chart shows how well the index has performed since the brief consolidation at the beginning of September with five accumulation days and only two days when profit taking produced a small loss.
Friday's accumulation day is slightly suspect because it was also a 'quadruple witching' day. The spike in volume is caused by fund managers closing and opening options and futures contracts but the small gain shows that the underlying trend is still bullish.
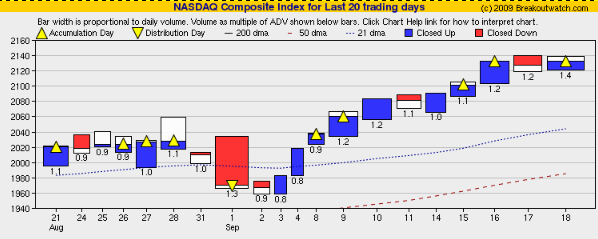
On our equivolume chart, the width of the day's 'candle' and the number below the candle represent the ratio of the volume to the 50 day average volume. Note that the trend in September has been to beat the average daily volume. The average volume is increasing and each day the volume is beating the average so volume is actually rising exponentially, which demonstrates that more and more money is flowing into stocks.
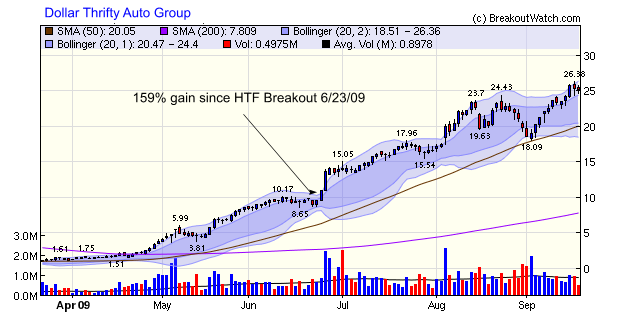
This increase in volume and upward price trend has produced an increase in the number of breakouts and an improvement in their average gains for the week. In our top tip below we show that the High Tight Flag pattern is producing some excellent results. Here is an example of a high flyer breakout from a HTF pattern.
High Tight Flag Breakouts
Outperform the Rest
The market recovery this year has created many cup-with handle patterns as stocks recover from the bear market but conditions have been just as favorable for the High Tight Flag (HTF) pattern. Once quite rare, the V-shaped market recovery since March has produced a plethora of breakouts from this pattern as so many stocks have gained 100% or more in a short time frame. In fact, the number of successful breakouts from this pattern is second only to the Cup-with-Handle pattern.
Interestingly, far from suffering exhaustion after their rapid rise,
HTF breakouts sustain their momentum and have outperformed the other
patterns, as the following table shows.
Breakout
Performance over Last 90 Days |
||
|---|---|---|
| Base |
Count |
Average Gain to Intraday High |
High Tight Flag |
64 |
28.1% |
Cup-with-Handle |
79 |
21.8% |
Head and Shoulders Bottom |
3 |
25.1% |
Flat Base |
8 |
9.0% |
Although the steep market ascent is now slowing, the HTF breakouts
continue to perform well. Of the fourteen breakouts this week that
gained at least 10% after breakout, eleven of those were from an HTF
base and just three from a CwH base.
| B'out Date | Symbol | Base |
B'Out Price | RS Rank | Gain at Intraday High |
|---|---|---|---|---|---|
| 9/14/2009 | PERY | HTF | 13.43 | 88 | 26.58 |
| 9/14/2009 | IRE | HTF | 16.05 | 99 | 25.73 |
| 9/16/2009 | USG | CwH | 15.91 | 84 | 24.95 |
| 9/16/2009 | AIB | HTF | 8.44 | 93 | 23.46 |
| 9/15/2009 | REXX | CwH | 7.2 | 82 | 19.17 |
| 9/14/2009 | MAC | HTF | 30.22 | 90 | 17.5 |
| 9/16/2009 | GCI | HTF | 9.22 | 93 | 16.38 |
| 9/15/2009 | MSO | HTF | 7.62 | 94 | 15.98 |
| 9/14/2009 | SLG | HTF | 38.5 | 87 | 15.87 |
| 9/15/2009 | BYD | CwH | 11.18 | 85 | 14.22 |
| 9/15/2009 | GET | HTF | 21.97 | 91 | 14.16 |
| 9/15/2009 | LENB | HTF | 12.49 | 88 | 11.05 |
| 9/15/2009 | SOA | HTF | 12.45 | 98 | 10.6 |
| 9/15/2009 | VCI | HTF | 16.25 | 99 | 10.15 |
| Index | Value | Change Week | Change YTD | Trend | ||||||||||||||||||||||||||||||||||||
|---|---|---|---|---|---|---|---|---|---|---|---|---|---|---|---|---|---|---|---|---|---|---|---|---|---|---|---|---|---|---|---|---|---|---|---|---|---|---|---|---|
| Dow | 9820.2 | 2.24% | 11.89% | Down | ||||||||||||||||||||||||||||||||||||
| NASDAQ | 2132.86 | 2.5% | 35.25% | Up | ||||||||||||||||||||||||||||||||||||
| S&P 500 | 1068.3 | 2.45% | 18.27% | Up | ||||||||||||||||||||||||||||||||||||
| Russell 2000 | 617.88 | 4.09% | 23.71% | Up | ||||||||||||||||||||||||||||||||||||
| Wilshire 5000 | 11032.2 | 2.6% | 21.4% | Up | ||||||||||||||||||||||||||||||||||||
1The Market Signal is derived from our proprietary
market model. The market model is described on the site. 2The site also shows industry rankings based on fundamentals, combined technical and fundamentals, and on price alone. The site also shows daily industry movements. |
||||||||||||||||||||||||||||||||||||||||
# of Breakouts |
Period Average1 |
Max. Gain During Period2 |
Gain at Period Close3 |
|
|---|---|---|---|---|
| This Week | 29 | 13.69 | 11.05% | 6.81% |
| Last Week | 23 | 11.15 | 12.22% | 6.31% |
| 13 Weeks | 182 | 13.77 | 22.81% |
13.92% |
2This represents the return if each stock were bought at its breakout price and sold at its intraday high.
3This represents the return if each stock were bought at its breakout price and sold at the most recent close.
Category |
Symbol |
Company Name |
Expected Gain1 |
|---|---|---|---|
| Best Overall | ADPI | American Dental Partners | 0 |
| Top Technical | NGSX | NEUROGESX, INC. | 0 |
| Top Fundamental | CAST | CHINACAST EDUCATION | 0 |
| Top Tech. & Fund. | CAST | CHINACAST EDUCATION | 0 |
Category |
Symbol |
Company Name |
Expected Gain1 |
|---|---|---|---|
| Best Overall | AMSC | American Superconductor | 56 |
| Top Technical | AMSC | American Superconductor | 56 |
| Top Fundamental | AMSC | American Superconductor | 56 |
| Top Tech. & Fund. | AMSC | American Superconductor | 56 |
If you received this newsletter from a friend and you would like to receive it regularly please go to the BreakoutWatch.com site and enter as a Guest. You will then be able to register to receive the newsletter.
Copyright © 2009 NBIcharts, LLC dba BreakoutWatch.com.
All rights reserved.
"
BreakoutWatch," the BreakoutWatch.com "eye" logo, and the
slogan "tomorrow's breakouts today" are service marks of NBIcharts
LLC. All other marks are the property of their respective owners, and are
used for descriptive purposes only.
BreakoutWatch is not affiliated with Investor's Business Daily or with Mr. William O'Neil.
Our site, research and analysis is supported entirely by subscription and is free from advertising.