| Market Summary | Weekly Breakout Report | Top Breakout Choices | Top 2nd Chances | New Features | Tip of the Week |
Rising unemployment and falling industrial production bode ill for the economic recovery and with it corporate earnings. Investors have been nervous for some weeks that the market's gains have outstripped earnings potential and in the last two weeks that nervousness graduated to fear. That fear has started to have a tangible impact on stock prices as we shall see.
As usual we consider the NASDAQ Composite because it is from that exchange that the most profitable breakouts arise. The one year weekly chart shows that we just endured the first back-to-back weekly loss since the recovery began on March 9. This was also the biggest weekly loss both in points and percentage since March 9. The index is testing support at the 10 week (50 day) moving average level which it hasn't done since the first week of July. At that time, the index recovered strongly after a double test of support, in part due to the 'cash-for-clunkers' program which came on-stream in July. With no such stimulus to lift earnings prospects now, manufacturing still contracting and unemployment rising, we could well see the 50 dma support level breached decisively in the next few days.
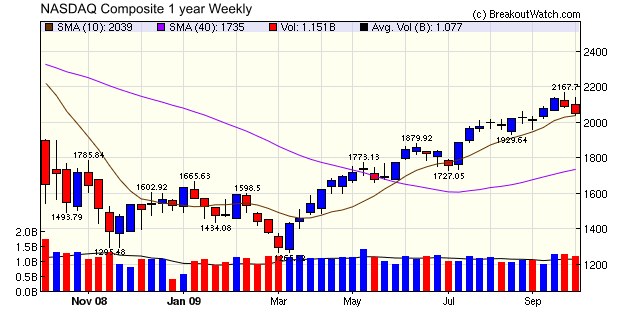
If the 50 dma support level is breached then the next significant support level is at 1880, an 11.6% drop from Friday's close. A breach of support would be a signal to consider shorting some of the stocks on our short watchlists. On Friday we issued ten confirmed breakdown alerts, a sure signal that there are now shorting opportunities with more to come.
Not really a top tip (yet) but interesting nonetheless.
A subscriber has hypothesized that breakouts are more successful when the volume on the day after breakout exceeds the breakout day volume. He also hypothesized that the failure rate is lower in that case.
A preliminary look at our data suggests that the gain after breakout is indeed superior in this case but that the failure rate is not improved. This deserves more study over a longer time period (we can go back to April, 2003) to confirm the result. We also need to determine if the improvement in return offsets the (possibly) higher price that would be paid by waiting for the second day's volume. We will study this next week.
Do you have a system that you believe works but needs more rigorous testing and analysis? If so let us know and we will backtest it against our historical data and publish the results.
| Index | Value | Change Week | Change YTD | Trend | ||||||||||||||||||||||||||||||||||||
|---|---|---|---|---|---|---|---|---|---|---|---|---|---|---|---|---|---|---|---|---|---|---|---|---|---|---|---|---|---|---|---|---|---|---|---|---|---|---|---|---|
| Dow | 9487.67 | -1.84% | 8.1% | Down | ||||||||||||||||||||||||||||||||||||
| NASDAQ | 2048.11 | -2.05% | 29.87% | Up | ||||||||||||||||||||||||||||||||||||
| S&P 500 | 1025.21 | -1.84% | 13.5% | Up | ||||||||||||||||||||||||||||||||||||
| Russell 2000 | 580.2 | -3.13% | 16.17% | Up | ||||||||||||||||||||||||||||||||||||
| Wilshire 5000 | 10567.1 | -1.9% | 16.29% | Up | ||||||||||||||||||||||||||||||||||||
1The Market Signal is derived from our proprietary
market model. The market model is described on the site. 2The site also shows industry rankings based on fundamentals, combined technical and fundamentals, and on price alone. The site also shows daily industry movements. |
||||||||||||||||||||||||||||||||||||||||
# of Breakouts |
Period Average1 |
Max. Gain During Period2 |
Gain at Period Close3 |
|
|---|---|---|---|---|
| This Week | 12 | 14.23 | 4.81% | -2.54% |
| Last Week | 11 | 14.23 | 6.87% | -4.31% |
| 13 Weeks | 189 | 15.08 | 20.98% |
4.31% |
2This represents the return if each stock were bought at its breakout price and sold at its intraday high.
3This represents the return if each stock were bought at its breakout price and sold at the most recent close.
Category |
Symbol |
Company Name |
Expected Gain1 |
|---|---|---|---|
| Best Overall | GMK | Gruma Sa De Cv Ads | 107 |
| Top Technical | NGLS | TARGA RES. PARTNERS | 48 |
| Top Fundamental | CACC | Credit Acceptance Corp | 48 |
| Top Tech. & Fund. | NOG | NORTHERN OIL AND GAS | 107 |
Category |
Symbol |
Company Name |
Expected Gain1 |
|---|---|---|---|
| Best Overall | NOG | NORTHERN OIL AND GAS | 115 |
| Top Technical | WNS | WNS (Holdings) Ltd | 65 |
| Top Fundamental | GMCR | Green Mountain Coffee Roasters | 58 |
| Top Tech. & Fund. | GMCR | Green Mountain Coffee Roasters | 58 |
If you received this newsletter from a friend and you would like to receive it regularly please go to the BreakoutWatch.com site and enter as a Guest. You will then be able to register to receive the newsletter.
Copyright © 2009 NBIcharts, LLC dba BreakoutWatch.com.
All rights reserved.
"
BreakoutWatch," the BreakoutWatch.com "eye" logo, and the
slogan "tomorrow's breakouts today" are service marks of NBIcharts
LLC. All other marks are the property of their respective owners, and are
used for descriptive purposes only.
BreakoutWatch is not affiliated with Investor's Business Daily or with Mr. William O'Neil.
Our site, research and analysis is supported entirely by subscription and is free from advertising.