| Market Summary | Weekly Breakout Report | Top Breakout Choices | Top 2nd Chances | New Features | Tip of the Week |
As the recovery proceeds companies prefer to make productivity improvements by investing in technology before people. This is one reason why we can have a recovery at the same time as the economy continues to lose jobs. It also explains why earnings expectations for technology companies are higher than for the rest of the market, which goes some way to explaining why the NASDAQ Composite has vastly outperformed the S&P 500 for the year (36% gain vs 20%).
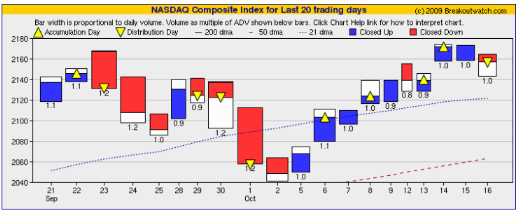
The NASDAQ's gains have come in a series of spurts followed by a short period of consolidation. Our equivolume chart of the NASDAQ Composite for the last four weeks shows that the beginning of October marked the beginning of another of those spurts with consolidation now beginning again.
The 9 month NASDAQ daily chart shows that we have seen this pattern several times now. The chart below shows the 1-standard deviation and 2-standard deviation Bollinger Bands. What we observe is that there are periods of two to three weeks where the index rides up the upper range but starts to correct as soon as the price falls to within the 1-standard deviation band. At that point the price slides until it hits the lower 2-standard deviation boundary but then quickly reverses to start to rise again. Note how long the periods of up trend are with relatively slow rollovers to consolidation compared to rapid reversal when the lower band is breached.
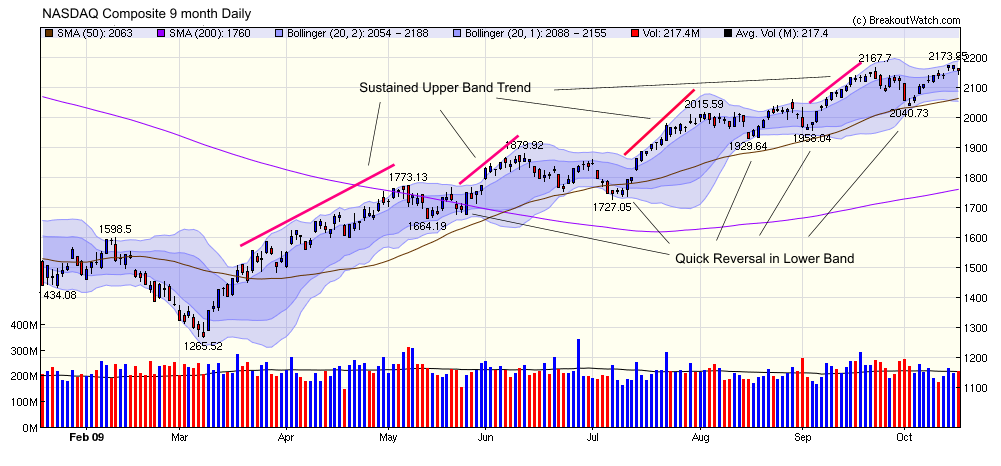
The inference from this is that one should hold (that is not take out new positions) once the index falls to within the 1-standard deviation band - as it has now - and then start to add to holdings when the index reverses in the outer bottom band. If the index falls below its 50 dma, as it did in early July, then it would be prudent for it to wait until it has recovered above the 50 dma.
There are no guarantees of course that the future will be like the recent past but this is a reasonable assumption until the index closes consistently below its 50 day moving average.
| Index | Value | Change Week | Change YTD | Trend | ||||||||||||||||||||||||||||||||||||
|---|---|---|---|---|---|---|---|---|---|---|---|---|---|---|---|---|---|---|---|---|---|---|---|---|---|---|---|---|---|---|---|---|---|---|---|---|---|---|---|---|
| Dow | 9995.91 | 1.33% | 13.9% | Down | ||||||||||||||||||||||||||||||||||||
| NASDAQ | 2156.8 | 0.82% | 36.76% | Up | ||||||||||||||||||||||||||||||||||||
| S&P 500 | 1087.68 | 1.51% | 20.42% | Up | ||||||||||||||||||||||||||||||||||||
| Russell 2000 | 616.18 | 0.2% | 23.37% | Up | ||||||||||||||||||||||||||||||||||||
| Wilshire 5000 | 11219.4 | 1.37% | 23.46% | Up | ||||||||||||||||||||||||||||||||||||
1The Market Signal is derived from our proprietary
market model. The market model is described on the site. 2The site also shows industry rankings based on fundamentals, combined technical and fundamentals, and on price alone. The site also shows daily industry movements. |
||||||||||||||||||||||||||||||||||||||||
# of Breakouts |
Period Average1 |
Max. Gain During Period2 |
Gain at Period Close3 |
|
|---|---|---|---|---|
| This Week | 8 | 13.23 | 5.03% | 2% |
| Last Week | 9 | 14.69 | 15.1% | 9.03% |
| 13 Weeks | 173 | 15.23 | 21.07% |
10.85% |
2This represents the return if each stock were bought at its breakout price and sold at its intraday high.
3This represents the return if each stock were bought at its breakout price and sold at the most recent close.
Category |
Symbol |
Company Name |
Expected Gain1 |
|---|---|---|---|
| Best Overall | SWC | Stillwater Mining Co | 106 |
| Top Technical | CBOU | Caribou Coffee Company Inc | 80 |
| Top Fundamental | EJ | E-HOUSE (CHINA) HOLDINGS LIMIT | 61 |
| Top Tech. & Fund. | EJ | E-HOUSE (CHINA) HOLDINGS LIMIT | 61 |
Category |
Symbol |
Company Name |
Expected Gain1 |
|---|---|---|---|
| Best Overall | WNS | WNS (Holdings) Ltd | 64 |
| Top Technical | WNS | WNS (Holdings) Ltd | 64 |
| Top Fundamental | RVBD | Riverbed Technologies Inc | 54 |
| Top Tech. & Fund. | RVBD | Riverbed Technologies Inc | 54 |
If you received this newsletter from a friend and you would like to receive it regularly please go to the BreakoutWatch.com site and enter as a Guest. You will then be able to register to receive the newsletter.
Copyright © 2009 NBIcharts, LLC dba BreakoutWatch.com.
All rights reserved.
"
BreakoutWatch," the BreakoutWatch.com "eye" logo, and the
slogan "tomorrow's breakouts today" are service marks of NBIcharts
LLC. All other marks are the property of their respective owners, and are
used for descriptive purposes only.
BreakoutWatch is not affiliated with Investor's Business Daily or with Mr. William O'Neil.
Our site, research and analysis is supported entirely by subscription and is free from advertising.