| Market Summary | Weekly Breakout Report | Top Breakout Choices | Top 2nd Chances | New Features | Tip of the Week |
There were no breakouts this week! That's a sure sign that the best thing to do is to hold off on taking new positions and take profits where you can and cut losses where you can't.
Although the market moved higher on Thursday on the strength of the 3rd Quarter GDP number, the savvy investor recognized that the number was artificially inflated by Government spending and volume was notably weaker than the day before. A reverse on Friday was to be expected but weaker than expected consumer spending and no increase in incomes, despite the GDP growth, turned the reversal into a rout. Although the markets closed a little above the day's lows on Friday, on balance it looks as though the consolidation will continue.
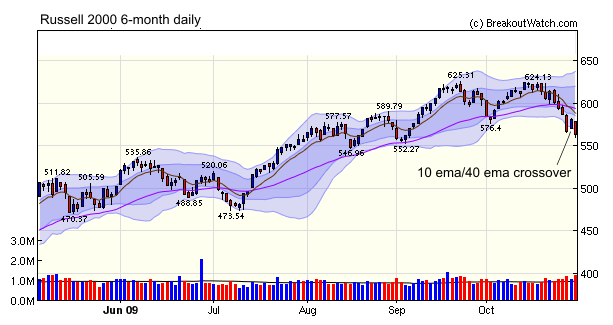
Thursday's gains were insufficient to support the upward trend of the Russell 2000 and our trend indicator turned downward. The trend indicator includes consideration of the crossover of two exponential moving averages which are show on this chart.
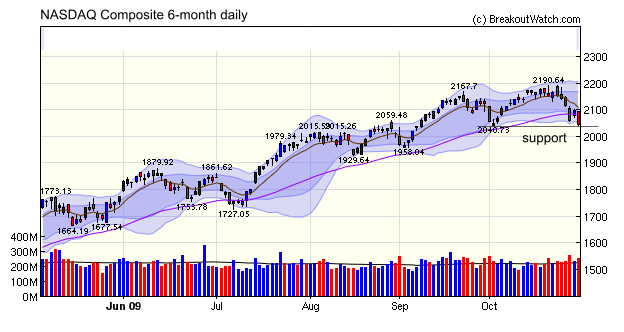
The NASDAQ trend signal uses slightly different ema's (because the volatilities of the two indexes are different) but we see that the crossover point is fast approaching for the index also. The NASDAQ is also testing support at 2040. On the more optimistic side, we see that the NASDAQ has fallen below its 2-standard deviation Bollinger Band which can be a signal that a rebound is near. On the other hand, stocks have a tendency to track the outer band for several days before turning around.
| Index | Value | Change Week | Change YTD | Trend | ||||||||||||||||||||||||||||||||||||
|---|---|---|---|---|---|---|---|---|---|---|---|---|---|---|---|---|---|---|---|---|---|---|---|---|---|---|---|---|---|---|---|---|---|---|---|---|---|---|---|---|
| Dow | 9712.73 | -2.6% | 10.67% | Down | ||||||||||||||||||||||||||||||||||||
| NASDAQ | 2045.11 | -5.08% | 29.68% | Up | ||||||||||||||||||||||||||||||||||||
| S&P 500 | 1036.18 | -4.02% | 14.72% | Up | ||||||||||||||||||||||||||||||||||||
| Russell 2000 | 562.77 | -6.34% | 12.68% | Down | ||||||||||||||||||||||||||||||||||||
| Wilshire 5000 | 10619 | -4.48% | 16.86% | Up | ||||||||||||||||||||||||||||||||||||
1The Market Signal is derived from our proprietary
market model. The market model is described on the site. 2The site also shows industry rankings based on fundamentals, combined technical and fundamentals, and on price alone. The site also shows daily industry movements. |
||||||||||||||||||||||||||||||||||||||||
# of Breakouts |
Period Average1 |
Max. Gain During Period2 |
Gain at Period Close3 |
|
|---|---|---|---|---|
| This Week | 0 | 11.15 | 0% | 0% |
| Last Week | 12 | 12.08 | 5.37% | -9.97% |
| 13 Weeks | 156 | 12.38 | 19.37% |
-4.75% |
2This represents the return if each stock were bought at its breakout price and sold at its intraday high.
3This represents the return if each stock were bought at its breakout price and sold at the most recent close.
Category |
Symbol |
Company Name |
Expected Gain1 |
|---|---|---|---|
| Best Overall | ELRN | Elron Electronic Ind Ltd | 89 |
| Top Technical | CBOU | Caribou Coffee Company Inc | 78 |
| Top Fundamental | TRCR | Transcend Services Inc | 59 |
| Top Tech. & Fund. | TRCR | Transcend Services Inc | 59 |
Category |
Symbol |
Company Name |
Expected Gain1 |
|---|
If you received this newsletter from a friend and you would like to receive it regularly please go to the BreakoutWatch.com site and enter as a Guest. You will then be able to register to receive the newsletter.
Copyright © 2009 NBIcharts, LLC dba BreakoutWatch.com.
All rights reserved.
"
BreakoutWatch," the BreakoutWatch.com "eye" logo, and the
slogan "tomorrow's breakouts today" are service marks of NBIcharts
LLC. All other marks are the property of their respective owners, and are
used for descriptive purposes only.
BreakoutWatch is not affiliated with Investor's Business Daily or with Mr. William O'Neil.
Our site, research and analysis is supported entirely by subscription and is free from advertising.