| Market Summary | Weekly Breakout Report | Top Breakout Choices | Top 2nd Chances | New Features | Tip of the Week |
Now the index (and other benchmark indexes also) is showing signs of weakness. The 6-month daily chart is showing signs that the primary upward trend - bounded by the green lines - was broken by the breakthrough of the support line in early November. If so, then a new downward trend - bounded by the red lines is in place.
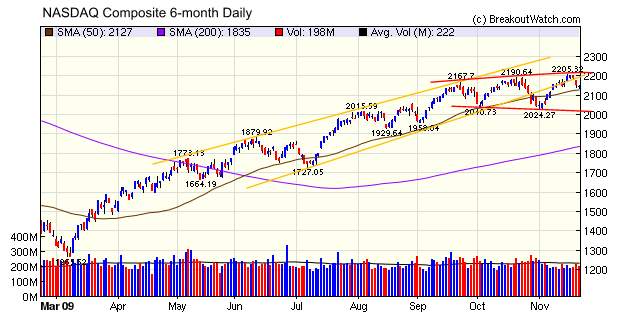
In that case, we could see consolidation continue until around 2000 - a correction of about 10%.
Of course, charts can't predict the future but investors are now seeking the safety of 3-month treasuries rather than invest in equities. This seems to be in response to increasing pessimism about the rate of recovery, or even its sustainability. Unless some unforseeable event occurs to reverse this pessimistic mood, that 10% correction looks very possible.
Our special introductory price of $9.95 for essential.breakoutwatch.com expires on November 30!
When you take a long position, the most you can lose is 100% of your investment if the price goes to zero. When shorting a stock, however, your risk is potentially infinite because there is no limit to the potential price move against you. This, among other factors, makes shorting a very risky game.
Investing in a short ETF, however, allows you to short the market, while limiting your loss in the same way that going long does. That's because the value of the short ETF can never fall below zero. While 'shorting' the market with these ETF's you are in fact taking a long position. A list of short ETF's we track follows. Note that some of these are very thinly traded.
| Symbol | Name |
| DOG | ProShares Short Dow30 ETF |
| DXD | ProShares UltraShort Dow30 ETF |
| MYY | ProShares Short MidCap400 ETF |
| MZZ | ProShares UltraShort MidCap400 ETF |
| PSQ | ProShares Short QQQ ETF |
| QID | ProShares UltraShort QQQ ETF |
| SDS | ProShares UltraShort S&P500 ETF |
| SH | ProShares Short S&P500 ETF |
| RWM | SHORT RUSSELL2000 PR |
| SDD | ULTRASHORT SMALLCAP6 |
| TWM | ULTRASHORT RUSSELL20 |
| DUG | ULTRASHORT OIL & GAS |
| SIJ | ULTRASHORT INDUSTRIA |
| SKF | ULTRASHORT FINANCIAL |
| REW | ULTRASHORT TECHNOLOG |
| RXD | ULTRASHORT HEALTH CA |
| SDP | ULTRASHORT UTILITIES |
| SMN | ULTRASHORT BASIC MAT |
| SRS | ULTRASHORT REAL ESTA |
| SSG | ULTRASHORT SEMICONDU |
| SZK | ULTRASHORT CONSUMER |
| SHM | SPDR LEHMAN SHORT TE |
| EFU | PROSHARES ULTRASHORT |
| EEV | PROSHARES UTLRASHORT |
| EFZ | PROSHARES SHORT MSCI |
| EUM | Short MSCI Emerging Markets ProShares |
| SMB | Market Vectors-Lehman Brothers AMT-Free Short Muni |
A complete list of ETF's and their rankings and performance is available in the Industry Analysis area of our site.
| Index | Value | Change Week | Change YTD | Trend | ||||||||||||||||||||||||||||||||||||
|---|---|---|---|---|---|---|---|---|---|---|---|---|---|---|---|---|---|---|---|---|---|---|---|---|---|---|---|---|---|---|---|---|---|---|---|---|---|---|---|---|
| Dow | 10318.2 | 0.67% | 17.57% | Down | ||||||||||||||||||||||||||||||||||||
| NASDAQ | 2146.04 | -0.68% | 36.08% | Up | ||||||||||||||||||||||||||||||||||||
| S&P 500 | 1091.38 | 0.04% | 20.83% | Up | ||||||||||||||||||||||||||||||||||||
| Russell 2000 | 584.68 | 0.69% | 17.06% | Down | ||||||||||||||||||||||||||||||||||||
| Wilshire 5000 | 11174.1 | 0.04% | 22.97% | Up | ||||||||||||||||||||||||||||||||||||
1The Market Signal is derived
from our proprietary market model. The market model is described on the
site.
2The site also shows industry rankings based on fundamentals, combined technical and fundamentals, and on price alone. The site also shows daily industry movements. |
||||||||||||||||||||||||||||||||||||||||
|
# of Breakouts
|
Period Average1
|
Max. Gain During Period2
|
Gain at Period Close3
|
|
|---|---|---|---|---|
| This Week | 7 | 10.38 | 6.3% | -0.5% |
| Last Week | 7 | 10.31 | 9.46% | 0.96% |
| 13 Weeks | 144 | 10.85 | 17.05% |
-1.39% |
2This represents the return if each stock were bought at its breakout price and sold at its intraday high.
3This represents the return if each stock were bought at its breakout price and sold at the most recent close.
|
Category
|
Symbol
|
Company Name
|
Expected Gain1
|
|---|---|---|---|
| Best Overall | INCY | Incyte Corp | 96 |
| Top Technical | CTB | Cooper Tire & Rubber Co | 47 |
| Top Fundamental | PWRD | PERFECT WORLD CO ADS | 49 |
| Top Tech. & Fund. | ATNI | Atlantic Tele-Network | 25 |
|
Category
|
Symbol
|
Company Name
|
Expected Gain1
|
|---|---|---|---|
| Best Overall | NGSX | NEUROGESX, INC. | 72 |
| Top Technical | NGSX | NEUROGESX, INC. | 72 |
| Top Fundamental | WG | Willbros Group Inc | 52 |
| Top Tech. & Fund. | WG | Willbros Group Inc | 52 |
If you received this newsletter from a friend and you would like to receive it regularly please go to the BreakoutWatch.com site and enter as a Guest. You will then be able to register to receive the newsletter.
Copyright © 2009 NBIcharts, LLC dba BreakoutWatch.com. All
rights reserved.
" BreakoutWatch," the BreakoutWatch.com "eye" logo, and the slogan
"tomorrow's breakouts today" are service marks of NBIcharts LLC. All
other marks are the property of their respective owners, and are used
for descriptive purposes only.
BreakoutWatch is not affiliated with Investor's Business Daily
or with Mr. William O'Neil.
Our site, research and analysis is supported entirely by subscription
and is free from advertising.