| Market Summary | Weekly Breakout Report | Top Breakout Choices | Top 2nd Chances | New Features | Tip of the Week |
Our commentary is even shorter than usual this week as we are traveling to Ohahu for a soccer tournament with our boys.
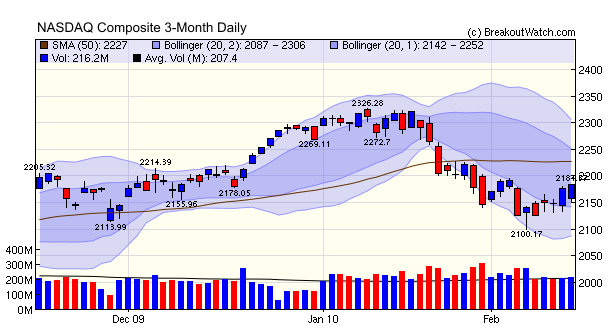
Last Friday was the first day of a rally attempt by the NASDAQ and on the fifth day, Thursday, we had a weak accumulation day, followed by another weak accumulation day on Friday. We say weak, because Thursday's volume was slightly below the 50 day average and Friday's only slightly above it.
The rally is likely to remain questionable until there is a resolution of the Greece debt problem and confidence returns that China can become the engine of world recovery.
No new features this week.
This week we complete our analysis of factors that can contribute to breakouts making at least 25% in the six months after breakout. When the analysis is finished, we will see that we have a viable system for achieving, even exceeding, our objective!
The story so far....
- We showed previously (Newsletter 01/09/2010) that while daily volume at breakout is helpful, it must be at least 2.25 times average daily volume to be a useful factor in selecting a breakout to trade.
- We went on to show (01/16/2010 and 01/30/2010) that RS Rank values above 92 were very helpful in selecting breakouts that exceeded our target.
- Last week, we showed that fundamentals, as measured by our CEF metric, could further improve our results, although only marginally.
CEF Metric Components
Firstly we recall that our CEF metric is calculated from an evaluation of 11 different measures of fundamental performance. Each of these is given a score in the range 0 - 1 calculated by prorating between the best possible performance and a minimum acceptable level of performance as shown in this table.
| CEF |
Performance Measured |
Requirement for Max. Score |
Cut-off for Minimum Score |
Max Score |
|---|---|---|---|---|
| 1 | Quarter over Quarter Earnings Growth Rates | 2 Q's, each >= 18% | 2 Q’s, each < 0% | 1 |
| 2 | Positive Quarterly Earnings | 2 Q’s, each > 0 | 2 Q’s, each < 0 | 1 |
| 3 | Quarterly Earnings Growth Rate Acceleration | 4 Q’s, each > last | 4 Q’s, each < last | 1 |
| 4 | Year over Year Earnings Growth Rates | 4 FY’s, each >= 25% | 4 FY’s, each < 0% | 1 |
| 5 | Quarter over Quarter Sales Growth Rates | 2 Q’s, each >= 25% | 2 quarters, each < 0% | 1 |
| 6 | Quarterly Sales Growth Rate Acceleration | 4 Q’s, each > last | 4 quarters, each < last | 1 |
| 7 | Forward Earnings Growth Rates | >= 15% & > current Q | < 15% | 1 |
| 8 | Institutional Ownership | >= 5 holders & >= 0 net shares purchased |
< 1 holder & < 0 net shares purchased |
1 |
| 9 | Return on Equity | >= 17% | < 0% | 1 |
| 10 |
Cash Flow (cflo) |
cflo >= 120% earnings & cflo MRQ > 0 & cflo TTM > 0 |
cflo < 120% earnings & cflo MRQ < 0 & cflo TTM < 0 |
1 |
| 11 | Net Margins | Most recent FY max over last 3 FY’s | Most recent FY min over last 3 FY’s | 1 |
In previous weeks we have first presented a scatter plot of maximum gain after breakout against the variable we were measuring because a scatter plot gives a good visual representation of any potential relationship. We won't clutter the newsletter with those plots this week, because every one of the possible 11 scatter plots showed no perceivable correlation with performance after breakout.
However, we knew from last week that there is a meaningful relationship between CEF and performance after breakout so we ran a stepwise multiple regression using max. gain as the dependant variable. The multiple regression showed that only two CEF components were of any significance: CEF2 and CEF3, positive quarterly earnings (CEF2) and Quarterly Earnings Growth Rate Acceleration (CEF3). This result confirms that of all fundamental measures of performance, recent quarterly earnings is the most important factor in driving price upwards after breakout. This also explains why our Zacks strategy, based on earnings surprises, is successful.
Now, we will add a filter using CEF2 and CEF3 to our RS Rank filter and look at a scatter plot. We'll quickly cut to the chase and say that we found values equal to or higher than 0.6 gave the best results.
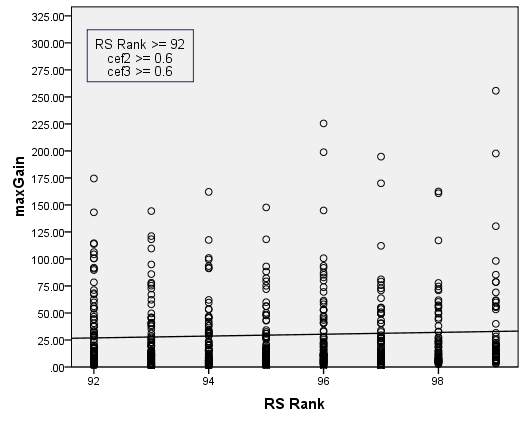
The regression line shows the expected value if max. gain is above 25%. In fact, the average max. gain is 29.6%. This is for stocks that had a volume of 1.5 times average daily volume on the day of breakout. For our sample since 2004, there were 624 stocks that met these criteria.
If we now add an additional filter for breakout day volume equal to or greater than 2.25 times average daily volume, we increase our average maximum gain to 33.4%. Since 2004, there were 345 breakouts in this group, an average of 57 per year.
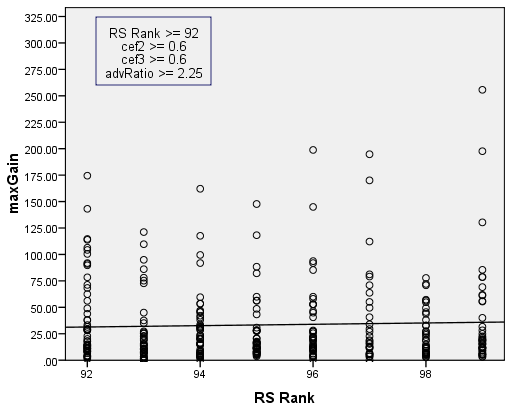
While the additional volume filter gives a substantial improvement in average maximum gain, it is difficult to use in real life. While we can buy as soon as a stock reaches its breakout price if it has the necessary RS, CEF2 and CEF3 value, we cannot know what the volume for that day will be until the end of the session.
Summary
We can now summarize our rules for buying breakouts from our Cup with Handle watchlist which offer the best chances of achieving an average return above 25%.
- Before the market opens, identify stocks on our CwH watchlist with an RS Rank of 92 or better (you can set a filter to select these for you)
- Check the CANTATA Evaluator for these stocks and select those with CEF2 >= 0.6 and CEF3 >= 0.6.
- Buy any of these stocks if we issue a breakout alert on them as close to the alert price as possible.
- Set a hard sell stop 8% below the alert price immediately after purchase.
Once you've bought a stock, when should you sell it? We'll look at that in forthcoming issues of the newsletter.
| Index | Value | Change Week | Change YTD | Trend | ||||||||||||||||||||||||||||||||||||
|---|---|---|---|---|---|---|---|---|---|---|---|---|---|---|---|---|---|---|---|---|---|---|---|---|---|---|---|---|---|---|---|---|---|---|---|---|---|---|---|---|
| Dow | 10099.1 | 0.87% | -3.15% | Up | ||||||||||||||||||||||||||||||||||||
| NASDAQ | 2183.53 | 1.98% | -3.77% | Down | ||||||||||||||||||||||||||||||||||||
| S&P 500 | 1075.51 | 0.88% | -3.55% | Up | ||||||||||||||||||||||||||||||||||||
| Russell 2000 | 610.72 | 2.99% | -3.68% | Down | ||||||||||||||||||||||||||||||||||||
| Wilshire 5000 | 11151.7 | 1.33% | -3.01% | Up | ||||||||||||||||||||||||||||||||||||
1The Market Signal is derived from our proprietary
market model. The market model is described on the site. 2The site also shows industry rankings based on fundamentals, combined technical and fundamentals, and on price alone. The site also shows daily industry movements. |
||||||||||||||||||||||||||||||||||||||||
# of Breakouts |
Period Average1 |
Max. Gain During Period2 |
Gain at Period Close3 |
|
|---|---|---|---|---|
| This Week | 13 | 12 | 4.66% | 3.08% |
| Last Week | 15 | 11.85 | 3.06% | -1.39% |
| 13 Weeks | 187 | 12.54 | 12.79% |
-1.38% |
2This represents the return if each stock were bought at its breakout price and sold at its intraday high.
3This represents the return if each stock were bought at its breakout price and sold at the most recent close.
Category |
Symbol |
Company Name |
Expected Gain1 |
|---|---|---|---|
| Best Overall | CKSW | ClickSoftware Technologies Ltd. | 111 |
| Top Technical | ADG | Allied Defense Group Inc. | 92 |
| Top Fundamental | NFLX | Netflix, Inc. | 49 |
| Top Tech. & Fund. | NFLX | Netflix, Inc. | 49 |
Category |
Symbol |
Company Name |
Expected Gain1 |
|---|---|---|---|
| Best Overall | LENB | LENNAR CORP CL B ( | 66 |
| Top Technical | NDN | 99 Cents Only Stores | 54 |
| Top Fundamental | CMG | Chipotle Mexican Grill, Inc. | 25 |
| Top Tech. & Fund. | CMG | Chipotle Mexican Grill, Inc. | 25 |
If you received this newsletter from a friend and you would like to receive it regularly please go to the BreakoutWatch.com site and enter as a Guest. You will then be able to register to receive the newsletter.
Copyright © 2010 NBIcharts, LLC dba BreakoutWatch.com.
All rights reserved.
"
BreakoutWatch," the BreakoutWatch.com "eye" logo, and the
slogan "tomorrow's breakouts today" are service marks of NBIcharts
LLC. All other marks are the property of their respective owners, and are
used for descriptive purposes only.
BreakoutWatch is not affiliated with Investor's Business Daily or with Mr. William O'Neil.
Our site, research and analysis is supported entirely by subscription and is free from advertising.