Weekly Newsletter 02/19/10
Login   Trial   Guest
You are receiving this email because you are or were a BreakoutWatch.com subscriber, or have subscribed to our weekly newsletter. This newsletter summarizes the breakout events of the week and provides additional guidance that does not fit into our daily format. It is published each weekend.
Market Summary Weekly Breakout Report Top Breakout Choices Top 2nd Chances New Features Tip of the Week
Prior editions of this newsletter with our valuable Tips of the Week are available here.
 Weekly Commentary  

Our trend indicator for the Russell 2000 turned up this week and the indicator for the NASDAQ should reverse  early next week also if the string of gains for the NASDAQ (now up to six consecutive days) continues. The index moved above its 50 day average on Thursday.

NASDAQ Equivolume chart

As you can see, there have been six accumulation days since the rally began on February 5, although none of them, with the exception of the first day, was achieved on above average volume, showing that the rally still lacks conviction. This weakness leaves the NASDAQ with the smallest gains for the week of  the major indexes and it remains the biggest loser of the year so far.

This lack of volume has restricted the number of confirmed breakouts despite the healthy price gains over the last two weeks.

 New Features this Week Additional Value that we added this week

Following on from our work on identifying the criteria that give the best possibility of achieving a 25% gain after breakout from a cup-with-handle(CwH) pattern, we have added a 'thumbs up' indicator to our CwH watchlist, Alerts Issued Today and Alert Monitor displays that identifies a stock as Meets Target Criteria (MTC).

A partial screen shot of the CwH watchlist:

CwH watchlist with MTC indicator

A partial screen shot of the Alert Monitor display:

Alert Monitor


This Week's Top Tip Tips for getting the most out of our site

Factors Affecting Performance After Breakout

If you missed the articles we have run in the last few weeks, here are links to each of them.

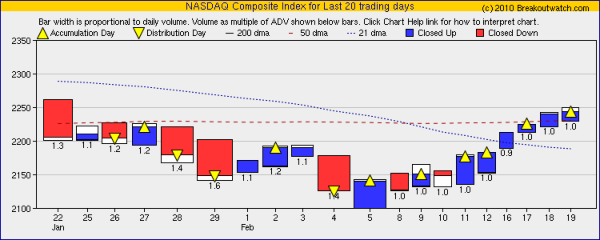
Part 1: The Influence of Breakout Day Volume

Part 2: The Influence of RS Rank

Part 3: Further Analysis of RS Rank

Part 4: The Influence of Fundamentals, Rank in Industry and Industry Rank

Part 5: The Influence of Specific Fundamental Factors and Conclusion

We want to emphasize that the criteria we have selected do not guarantee that the performance of stocks after breakout will generate a gain of at least 25%. As you can see from the scatter plots in our articles, there is wide dispersion in the gains seen at every level of, for example, RS Rank. While stocks meeting our criteria have a better likelihood of delivering a 25% gain, they can also fail dramatically. Note that our analysis is based on using a stop loss of 8% and the results are only valid under that assumption.

I was asked in our support forum if, out of, say, four stocks with an RS Rank of at least 92, one should always choose the higher RS ranked stock. Here's my answer....

Remember that past performance is no guarantee of future returns. An RS Rank of 99 says that the past price performance was excellent and high cef2 and cef3 say earnings were very good also. But I wouldn't recommend buying a stock on this information alone. Use it only to winnow down the number of possible investment choices.

Remember the parable of the Thanksgiving Turkey - it gets fatter and fatter and life looks great until the day before thanksgiving*.  I imagine Bear Sterns and Lehman had very high RS Ranks before their turkey-like demise.

So some due diligence is also necessary and use stop loss to help protect against Black Swan*
 disasters.


Several subscribers have requested a backtest tool for all stocks in the CwH pattern similar to the Zacks Backtest tool. I'm working on it and hope to have it ready by next week.

* The Black Swan by N. N. Taleb cites the example of the turkey as showing that the future may be very different from the past.
 Market Summary Overview of market direction and industry rotation
Index Value Change Week Change YTD Trend
Dow 10402.3 3% -0.25% Up
NASDAQ 2243.87 2.76% -1.11% Down
S&P 500 1109.17 3.13% -0.53% Up
Russell 2000 631.62 3.42% -0.39% Up
Wilshire 5000 11499.6 3.12% 0.02% Up
 Best Performing Index
1 Week 13 Weeks 26 Weeks Year-to-Date
Russell 2000
3.42 %
Russell 2000
4.56 %
NASDAQ Composite
11.03 %
Wilshire 5000
0.02 %
 Best Performing Industry (by average technical score over each period)
1 Week 3 Weeks 13 Weeks 26 Weeks
Major Airlines Broadcasting - Radio Housewares & Accessories Housewares & Accessories
 Most Improved Industry (by change in technical rank2)
Aluminum
+ 54
Aluminum
+ 99
Long Distance Carriers
+ 213
Long Distance Carriers
+ 210
Charts of each industry rank and performance over 12 months are available on the site

1The Market Signal is derived from our proprietary market model. The market model is described on the site.
2The site also shows industry rankings based on fundamentals, combined technical and fundamentals, and on price alone. The site also shows daily industry movements.
 Weekly Breakout Report How confirmed breakouts performed this week
# of Breakouts
Period Average1
Max. Gain During Period2
Gain at Period Close3
This Week 6 12.23 3.37% 1.64%
Last Week 13 12 7.4% 3.7%
13 Weeks 185 12.77 13.1%
1.75%
1The average number of breakouts in each week over the previous 13 weeks.
2This represents the return if each stock were bought at its breakout price and sold at its intraday high.
3This represents the return if each stock were bought at its breakout price and sold at the most recent close.
 Top Breakout Choices Stocks on our Cup-and-Handle list with best expected gain if they breakout
Category
Symbol
Company Name
Expected Gain1
Best Overall CROX CROCS Inc. 108
Top Technical CVVT China Valves Technology, Inc. 81
Top Fundamental CTRP Ctrip.com International Ltd. 51
Top Tech. & Fund. CTRP Ctrip.com International Ltd. 51
1This is the gain predicted by our Expected Gain model if the stock breaks out. Expected Gains for all cup-and-handle stocks are published on our site.
 Top Second Chances Stocks that broke out this week and are still in buyable range
Category
Symbol
Company Name
Expected Gain1
Best Overall MSSR McCormick & Schmick's Seafood Restaurants, Inc 85
Top Technical RTEC Rudolph Technologies Inc. 81
Top Fundamental SIRO Sirona Dental Systems Inc. 44
Top Tech. & Fund. SIRO Sirona Dental Systems Inc. 44
1This is the gain predicted by our Expected Gain model after the stock has broken out which uses the volume on breakout as a predictive term. Because the model variance is +/- 38% the expectation can be negative.

If you received this newsletter from a friend and you would like to receive it regularly please go to the BreakoutWatch.com site and enter as a Guest. You will then be able to register to receive the newsletter.

Copyright © 2010 NBIcharts, LLC dba BreakoutWatch.com. All rights reserved.
" BreakoutWatch," the BreakoutWatch.com "eye" logo, and the slogan "tomorrow's breakouts today" are service marks of NBIcharts LLC. All other marks are the property of their respective owners, and are used for descriptive purposes only.

BreakoutWatch is not affiliated with Investor's Business Daily or with Mr. William O'Neil. Our site, research and analysis is supported entirely by subscription and is free from advertising.


To unsubscribe from further breakoutwatch.com newsletters, please click here.