| Market Summary | Weekly Breakout Report | Top Breakout Choices | Top 2nd Chances | New Features | Tip of the Week |
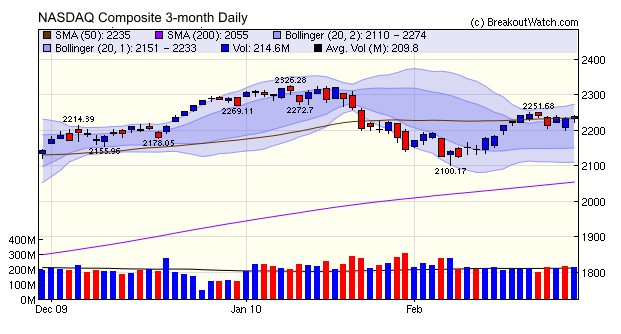
The major indexes consolidated after rising 7% between February 4 and February 22 following continued mixed economic reports in the domestic and global economies. The sideways movement is evident in the 3 month NASDAQ Composite chart.
The extent to which the economy is dominating the markets is evidenced by the decline in the indexes since the start of the year despite a strong earnings season. Positive surprises outnumbered disappointments by more than 4:1 and average earnings were up 43% over a year ago (over 10% if the financial sector is excluded). With earnings season almost over, the domestic and global economies are likely to play an even more important role in determining market trends.
Despite the decline in the major indexes this week, breakouts increased over the week before and made healthy gains after breakout as shown in the intraday gain column of our table of breakouts for the week. At weeks end, only one breakout had failed to make progress.
| Breakout Date | Symbol | Chart Pattern | BoP | RS Rank | Gain | Intraday Gain |
|---|---|---|---|---|---|---|
| 02/26/10 | ODP | CwH | 7.07 | 97 | 2.12% | 3.11% |
| 02/26/10 | AMR | CwH | 9.15 | 89 | 0.44% | 1.09% |
| 02/25/10 | PPO | CwH | 13.88 | 83 | 7.85% | 10.37% |
| 02/25/10 | LINTA | CwH | 11.63 | 91 | 8.25% | 10.15% |
| 02/25/10 | ETM | CwH | 9.45 | 98 | 7.62% | 10.48% |
| 02/24/10 | ASH | CwH | 47.01 | 97 | 0.15% | 0.96% |
| 02/23/10 | WFMI | CwH | 34.72 | 87 | 2.22% | 3.80% |
| 02/23/10 | ODP | CwH | 6.73 | 93 | 7.28% | 8.32% |
| 02/22/10 | KEI | CwH | 6.51 | 88 | 10.45% | 15.98% |
| 02/22/10 | ATV | CwH | 6.9 | 82 | -6.52% | 5.80% |
| 02/22/10 | ACTG | CwH | 9.45 | 87 | 4.97% | 6.56% |
No new features this week.
As we reported last week, we are working on a version of the Zacks Strategy Simulation to be applied to our cup-with-handle watchlist. We had hoped to have it ready for release this week, but we need to add some more options and complete testing.
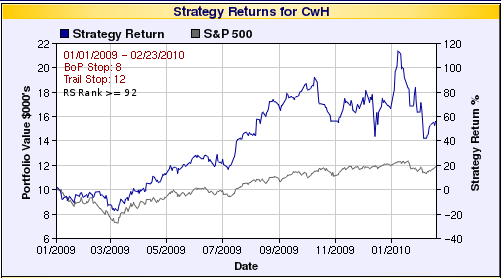
Nevertheless, we can show you the
results since 2009 using the target criteria which we developed over
the last few weeks.
Here is a chart of the results
using a strategy of buying on alert if
the RS Rank is at least 92 and using an 8% stop below the breakout
price and a 12% trailing stop (these stop values need further
refinement).
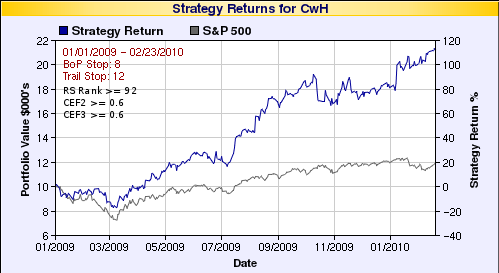
Now, if we add a filter for CEF2
>= 0.6 and CEF3 >= 0.6, we get a significant improvement:
I am hopeful that this tool will
prove
an invaluable resource for refining our target criteria further. Look
forward to its release next week!
| Index | Value | Change Week | Change YTD | Trend | ||||||||||||||||||||||||||||||||||||
|---|---|---|---|---|---|---|---|---|---|---|---|---|---|---|---|---|---|---|---|---|---|---|---|---|---|---|---|---|---|---|---|---|---|---|---|---|---|---|---|---|
| Dow | 10325.3 | -0.74% | -0.98% | Up | ||||||||||||||||||||||||||||||||||||
| NASDAQ | 2238.26 | -0.25% | -1.36% | Up | ||||||||||||||||||||||||||||||||||||
| S&P 500 | 1104.49 | -0.42% | -0.95% | Up | ||||||||||||||||||||||||||||||||||||
| Russell 2000 | 628.56 | -0.48% | -0.87% | Up | ||||||||||||||||||||||||||||||||||||
| Wilshire 5000 | 11453.2 | -0.4% | -0.39% | Up | ||||||||||||||||||||||||||||||||||||
1The Market Signal is derived
from our proprietary market model. The market model is described on the
site.
2The site also shows industry rankings based on fundamentals, combined technical and fundamentals, and on price alone. The site also shows daily industry movements. |
||||||||||||||||||||||||||||||||||||||||
|
# of Breakouts
|
Period Average1
|
Max. Gain During Period2
|
Gain at Period Close3
|
|
|---|---|---|---|---|
| This Week | 11 | 12.46 | 6.97% | 4.08% |
| Last Week | 6 | 12.23 | 5.6% | -0.12% |
| 13 Weeks | 189 | 13.08 | 13.11% |
1.57% |
2This represents the return if each stock were bought at its breakout price and sold at its intraday high.
3This represents the return if each stock were bought at its breakout price and sold at the most recent close.
|
Category
|
Symbol
|
Company Name
|
Expected Gain1
|
|---|---|---|---|
| Best Overall | AEA | Advance America, Cash Advance Centers Inc. | 113 |
| Top Technical | CVVT | China Valves Technology, Inc. | 75 |
| Top Fundamental | ECPG | Encore Capital Group, Inc. | 62 |
| Top Tech. & Fund. | ECPG | Encore Capital Group, Inc. | 62 |
|
Category
|
Symbol
|
Company Name
|
Expected Gain1
|
|---|---|---|---|
| Best Overall | ATV | Acorn International, Inc. | 103 |
| Top Technical | WFMI | Whole Foods Market, Inc. | 52 |
| Top Fundamental | WFMI | Whole Foods Market, Inc. | 52 |
| Top Tech. & Fund. | WFMI | Whole Foods Market, Inc. | 52 |
If you received this newsletter from a friend and you would like to receive it regularly please go to the BreakoutWatch.com site and enter as a Guest. You will then be able to register to receive the newsletter.
Copyright © 2010 NBIcharts, LLC dba BreakoutWatch.com. All
rights reserved.
" BreakoutWatch," the BreakoutWatch.com "eye" logo, and the slogan
"tomorrow's breakouts today" are service marks of NBIcharts LLC. All
other marks are the property of their respective owners, and are used
for descriptive purposes only.
BreakoutWatch is not affiliated with Investor's Business Daily
or with Mr. William O'Neil.
Our site, research and analysis is supported entirely by subscription
and is free from advertising.