| Market Summary | Weekly Breakout Report | Top Breakout Choices | Top 2nd Chances | New Features | Tip of the Week |
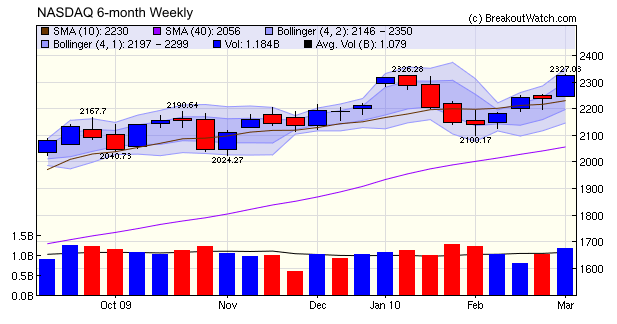
All of the major indexes are finally positive for the year and the NASDAQ Composite and Russell 2000 set new highs since October 2008. However, the NASDAQ's Friday high was only one point above its previous high and the index closed just lower. This means it is testing resistance and could move lower although that is likely to be short lived if it does so. The weekly chart shows the strength of the move up this week with higher than average volume.
Things are looking more promising. The number of breakouts increased sharply to 39 after just 13 last week.
Our new tool to backtest breakouts from a cup-with-handle pattern is finally ready!
This tool is similar to our Zacks Strong Buy backtest tool with some nice features specific to the CwH pattern:
- Set your own breakout volume level
The tool will find stocks that would have broken out if the required breakout volume is changed. This means you can adjust the definition of a breakout up or down from our standard 1.5 times adv definition and backtest using the new definition.
- Test sensitivity to RS Rank and our CEF2 (last two quarters of positive earnings) and CEF3 (accelerating quarterly earnings) metrics.
As we have reported over the last few weeks, performance after breakout can be improved by choosing stocks with a minimum RS Rank of 92 and CEF2 and CEF3 scores of at least 0.6. You can test this conclusion for different volume and price levels.
Please read the 'How to Use This Tool' instructions before using.
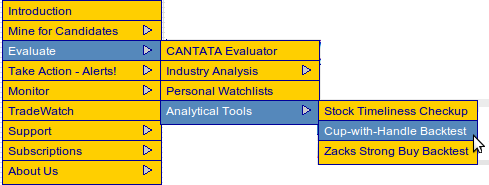
The tool can be accessed under the Evaluate menu as shown here:
As you use the CwH backtest tool, you will notice that it is extremely sensitive to the period and start and dates you use. This is because the tool buys and sells stocks in sequence and a change of just one day or a slight change in a single parameter can have a big effect on the sequence of buys and sells. (You can examine the sequence of buys and sells in detail by clicking the 'View Transaction Data' button and copying the results into a spreadsheet).
This sensitivity to the sequence presents a problem because it makes it difficult to decide on which set of parameters is optimal. This is a common problem and explains one of the major problems of backtesting.
The solution is to run hundreds of simulations with different input parameters and the stock sequence scrambled each time to find the most consistent set of parameters. We haven't yet been able to do that but will develop an additional tool to do so . It may take a few weeks, however.
A less optimal solution is to run the test with a high number of positions. While not representing what you may do in real life, it will gather the most stocks into the sample and be less sensitive to the effects of the buy and sell sequence.
Finally, simulations can take quite a while, be patient. Try running it for at most two years at a time over different time frames.
| Index | Value | Change Week | Change YTD | Trend | ||||||||||||||||||||||||||||||||||||
|---|---|---|---|---|---|---|---|---|---|---|---|---|---|---|---|---|---|---|---|---|---|---|---|---|---|---|---|---|---|---|---|---|---|---|---|---|---|---|---|---|
| Dow | 10566.2 | 2.33% | 1.33% | Up | ||||||||||||||||||||||||||||||||||||
| NASDAQ | 2326.35 | 3.94% | 2.52% | Up | ||||||||||||||||||||||||||||||||||||
| S&P 500 | 1138.69 | 3.1% | 2.12% | Up | ||||||||||||||||||||||||||||||||||||
| Russell 2000 | 666.02 | 5.96% | 5.04% | Up | ||||||||||||||||||||||||||||||||||||
| Wilshire 5000 | 11846.5 | 3.43% | 3.04% | Up | ||||||||||||||||||||||||||||||||||||
1The Market Signal is derived from our proprietary
market model. The market model is described on the site. 2The site also shows industry rankings based on fundamentals, combined technical and fundamentals, and on price alone. The site also shows daily industry movements. |
||||||||||||||||||||||||||||||||||||||||
# of Breakouts |
Period Average1 |
Max. Gain During Period2 |
Gain at Period Close3 |
|
|---|---|---|---|---|
| This Week | 39 | 13.92 | 7.18% | 5.65% |
| Last Week | 13 | 12.46 | 11.59% | 9.21% |
| 13 Weeks | 214 | 14.92 | 13.07% |
6.03% |
2This represents the return if each stock were bought at its breakout price and sold at its intraday high.
3This represents the return if each stock were bought at its breakout price and sold at the most recent close.
Category |
Symbol |
Company Name |
Expected Gain1 |
|---|---|---|---|
| Best Overall | AEA | Advance America, Cash Advance Centers Inc. | 115 |
| Top Technical | CVVT | China Valves Technology, Inc. | 80 |
| Top Fundamental | CAAS | China Automotive Systems Inc. | 74 |
| Top Tech. & Fund. | CTEL | City Telecom HK Ltd. | 75 |
Category |
Symbol |
Company Name |
Expected Gain1 |
|---|---|---|---|
| Best Overall | LIZ | Liz Claiborne Inc. | 104 |
| Top Technical | GET | Gaylord Entertainment Co. | 56 |
| Top Fundamental | PCLN | priceline.com Incorporated | 44 |
| Top Tech. & Fund. | PCLN | priceline.com Incorporated | 44 |
If you received this newsletter from a friend and you would like to receive it regularly please go to the BreakoutWatch.com site and enter as a Guest. You will then be able to register to receive the newsletter.
Copyright © 2010 NBIcharts, LLC dba BreakoutWatch.com.
All rights reserved.
"
BreakoutWatch," the BreakoutWatch.com "eye" logo, and the
slogan "tomorrow's breakouts today" are service marks of NBIcharts
LLC. All other marks are the property of their respective owners, and are
used for descriptive purposes only.
BreakoutWatch is not affiliated with Investor's Business Daily or with Mr. William O'Neil.
Our site, research and analysis is supported entirely by subscription and is free from advertising.