| Market Summary | Weekly Breakout Report | Top Breakout Choices | Top 2nd Chances | New Features | Tip of the Week |
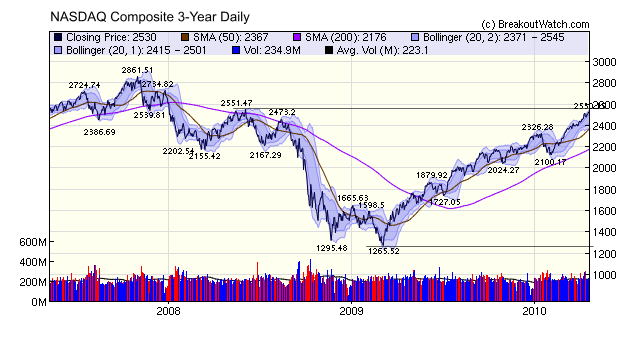
This week we take a longer view of the NASDAQ Composite since the start of the market downturn in late 2007. We see that the index has made a remarkable recovery since March, 2009 and has retraced 80% of its losses. We also see that it is at a significant resistance level. We have expected a period of consolidation for several weeks now which has not yet occurred so this might be the point at which the market takes a breather. We see that the index has been riding up the uppermost Bollinger Band for an extended period. While riding the upper band is not unusual, we have not seen anything like this recent behavior since the start of the rally last March. However, it is clear that confidence is returning as more and more good economic news accumulates so even if the markets do take a short pause, the prospects for a continued rally are good.
Google is now an excellent source of free real time financial data with an array of API's (Application Program Interface) which allow the development of some interesting applications.
We've taken advantage of that to build an application which monitors price and volume data for all the stocks on the 'essential' site's long watchlists. Price data is shown in real time while volume data is delayed by up to 20 minutes (less for NASDAQ stocks). The application compares real time prices to breakout prices and marks a stock as being a 'Possible Breakout' if the current price exceeds the breakout price (BoP). The application also shows the ratio of the actual volume to average volume so you can get a measure of the strength of the possible breakout. Data is refreshed every 5 minutes. Further information is provided by clicking a symbol on the watchlist monitor which brings up a real-time Google stock chart.
The monitor is accessed from the 'Watchlists' menu. Here's a reduced size screenshot of part of the display:
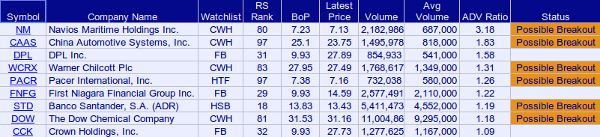
Although not as highly functional as our Alert Monitor on the main site, this should add considerable value to subscribers to the essential.breakoutwatch.com site. As we get more experience with the Google API we expect to add more functionality to the watchlist monitor.
We are rethinking our approach to email alerts and would like your
feedback.
Following an increase in real time data rates and the loss of a large
percentage of our subscribers after the market meltdown, we were forced
to economize on our data feeds. We did so by keeping the real time price feed and dropping real time volume quotes in favor of delayed
volume. The result was a mixture of real time prices (updated every
minute) and volume data delayed by 20 minutes. This is still the case as our subscriber level has
not yet recovered to the point where we can again afford full real time
alerts. The result is an email alert situation that is unsatisfactory for a couple of reasons:
- You will recall that our alerts require a volume projection.
After this change, we could no longer send out alerts as soon as the
markets opened so we started sending out alerts at 9:50 when volume
data was first available. Because most big price moves occur soon after
the open, this meant that many alerts were too late and too often a
significant price move in the opening minutes would not be notified
until 9:50. This problem is most noticeable with Zacks alerts which
tend to move up very quickly at the open.
- The volume projections are unreliable. If there is heavy volume in the opening minutes, this is projected as being heavy volume throughout the day and gives a false reading. Most alerts are not confirmed because the volume target for the day was not met.
The first problem would be resolved if we monitored the markets as soon
as they opened and sent alerts based on price only. A jump above the
BoP would be immediately recognized and an alert issued. This would
result in a lot more alerts, however.
If we retain the requirement that volume should be part of the alert,
we can resolve the unreliability of the projection by only sending an
alert when the breakout volume is actually met. This raises another
question, which is what should the breakout volume be? We have
found that volume only becomes really significant when above 2.25 times
average daily volume but waiting until that level is met could mean a
significant delay in issuing an alert.
What do you think? Please let us know by completing our really short survey.
| Index | Value | Change Week | Change YTD | Trend | ||||||||||||||||||||||||||||||||||||
|---|---|---|---|---|---|---|---|---|---|---|---|---|---|---|---|---|---|---|---|---|---|---|---|---|---|---|---|---|---|---|---|---|---|---|---|---|---|---|---|---|
| Dow | 11204.3 | 1.68% | 7.44% | Up | ||||||||||||||||||||||||||||||||||||
| NASDAQ | 2530.15 | 1.97% | 11.5% | Up | ||||||||||||||||||||||||||||||||||||
| S&P 500 | 1217.28 | 2.11% | 9.16% | Up | ||||||||||||||||||||||||||||||||||||
| Russell 2000 | 741.92 | 3.82% | 17.01% | Up | ||||||||||||||||||||||||||||||||||||
| Wilshire 5000 | 12745.8 | 2.36% | 10.86% | Up | ||||||||||||||||||||||||||||||||||||
1The Market Signal is derived from our proprietary
market model. The market model is described on the site. 2The site also shows industry rankings based on fundamentals, combined technical and fundamentals, and on price alone. The site also shows daily industry movements. |
||||||||||||||||||||||||||||||||||||||||
# of Breakouts |
Period Average1 |
Max. Gain During Period2 |
Gain at Period Close3 |
|
|---|---|---|---|---|
| This Week | 19 | 16.62 | 6.58% | 4.09% |
| Last Week | 22 | 16.08 | 8.61% | 5.9% |
| 13 Weeks | 245 | 17.23 | 19.15% |
14.22% |
2This represents the return if each stock were bought at its breakout price and sold at its intraday high.
3This represents the return if each stock were bought at its breakout price and sold at the most recent close.
Category |
Symbol |
Company Name |
Expected Gain1 |
|---|---|---|---|
| Best Overall | JASO | JA Solar Holdings Co., Ltd. | 110 |
| Top Technical | SWWC | Southwest Water Co. | 53 |
| Top Fundamental | CAAS | China Automotive Systems Inc. | 72 |
| Top Tech. & Fund. | CAAS | China Automotive Systems Inc. | 72 |
Category |
Symbol |
Company Name |
Expected Gain1 |
|---|---|---|---|
| Best Overall | MSO | Martha Stewart Living Omnimedia Inc. | 97 |
| Top Technical | OFG | Oriental Financial Group Inc. | 58 |
| Top Fundamental | TUP | Tupperware Brands Corporation | 40 |
| Top Tech. & Fund. | TUP | Tupperware Brands Corporation | 40 |
If you received this newsletter from a friend and you would like to receive it regularly please go to the BreakoutWatch.com site and enter as a Guest. You will then be able to register to receive the newsletter.
Copyright © 2010 NBIcharts, LLC dba BreakoutWatch.com.
All rights reserved.
"
BreakoutWatch," the BreakoutWatch.com "eye" logo, and the
slogan "tomorrow's breakouts today" are service marks of NBIcharts
LLC. All other marks are the property of their respective owners, and are
used for descriptive purposes only.
BreakoutWatch is not affiliated with Investor's Business Daily or with Mr. William O'Neil.
Our site, research and analysis is supported entirely by subscription and is free from advertising.