| Market Summary | Weekly Breakout Report | Top Breakout Choices | Top 2nd Chances | New Features | Tip of the Week |
The markets made their best weekly gains in over a year as traders
anticipate a strong 2nd quarter earnings season when compared to the
same quarter last year. We deliberately used the term 'traders' not
investors because 'investors' seem less enthusiastic as world wide
withdrawals from mutual funds topped $11 billion and inflows into money
market funds were the biggest in 18 months. (Source : Reuters)
Investors Business Daily is stating that the indexes are in a confirmed up-trend. It would seem that they are basing this on the recovery from the day's low on July 1 and then calling a follow-through day on July 7. Although they may be subsequently proved correct if the rebound is sustained, we think their reasoning is suspect as a look at the equivolume chart* for the DJI shows.
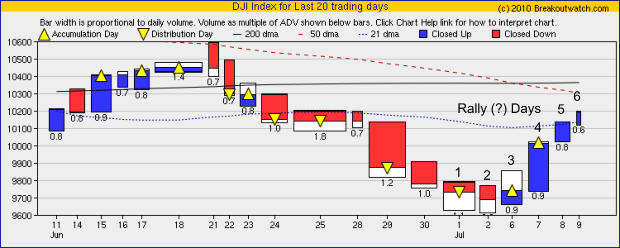
Day 1 of their rally was actually a distribution day. Although we grant that the majority of the volume may have come in the recovery phase, the distribution continued on day 2 and undercut the previous day's low both in the low of the day and at the close. In fact, July 2 should count as day 1 of the rally, in which case a follow through day (a gain of at least 2% beginning on the fourth day) has not yet occurred. However, How to Make Money in Stocks, does allow an exception of a follow-through day on the third day of a rally if the first, second and third days are very powerful. Even granting that we are in a short week with depressed volume, volumes were not impressive and only the move up on the 7th July could be classed as powerful.
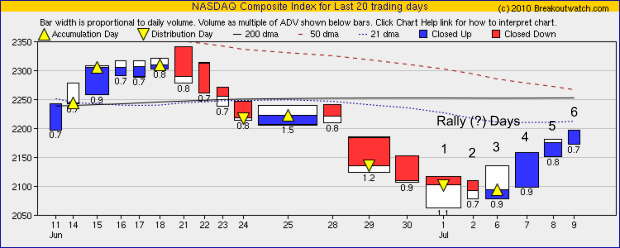
Identical arguments can be made for the NASDAQ equivolume chart.
We suspect that a confirmed up trend sells more newspapers and investors.com subscriptions than a down trend :).
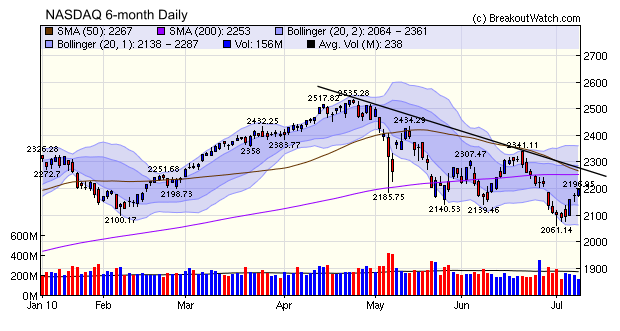
Finally, a look at the NASDAQ daily chart shows that three rally attempts since April have failed so it is too early to become excited over the latest one as there have been no game changing events to suggest that things are different, this time. In fact, American's are cutting back on their credit card debt and increasing their savings. While good for investment in the long term, this will not lead to a consumer led recovery in the near term.
* An equivolume chart denotes volume by the width of bar. We also display the volume compared to the 50 day average below the bar.
Investors Business Daily is stating that the indexes are in a confirmed up-trend. It would seem that they are basing this on the recovery from the day's low on July 1 and then calling a follow-through day on July 7. Although they may be subsequently proved correct if the rebound is sustained, we think their reasoning is suspect as a look at the equivolume chart* for the DJI shows.
Day 1 of their rally was actually a distribution day. Although we grant that the majority of the volume may have come in the recovery phase, the distribution continued on day 2 and undercut the previous day's low both in the low of the day and at the close. In fact, July 2 should count as day 1 of the rally, in which case a follow through day (a gain of at least 2% beginning on the fourth day) has not yet occurred. However, How to Make Money in Stocks, does allow an exception of a follow-through day on the third day of a rally if the first, second and third days are very powerful. Even granting that we are in a short week with depressed volume, volumes were not impressive and only the move up on the 7th July could be classed as powerful.
Identical arguments can be made for the NASDAQ equivolume chart.
We suspect that a confirmed up trend sells more newspapers and investors.com subscriptions than a down trend :).
Finally, a look at the NASDAQ daily chart shows that three rally attempts since April have failed so it is too early to become excited over the latest one as there have been no game changing events to suggest that things are different, this time. In fact, American's are cutting back on their credit card debt and increasing their savings. While good for investment in the long term, this will not lead to a consumer led recovery in the near term.
* An equivolume chart denotes volume by the width of bar. We also display the volume compared to the 50 day average below the bar.
No new features this week.
This feature will return following the summer school break.
| Index | Value | Change Week | Change YTD | Trend | ||||||||||||||||||||||||||||||||||||
|---|---|---|---|---|---|---|---|---|---|---|---|---|---|---|---|---|---|---|---|---|---|---|---|---|---|---|---|---|---|---|---|---|---|---|---|---|---|---|---|---|
| Dow | 10198 | 5.28% | -2.21% | Up | ||||||||||||||||||||||||||||||||||||
| NASDAQ | 2196.45 | 5% | -3.2% | Down | ||||||||||||||||||||||||||||||||||||
| S&P 500 | 1077.96 | 5.42% | -3.33% | Down | ||||||||||||||||||||||||||||||||||||
| Russell 2000 | 629.43 | 5.09% | -0.73% | Down | ||||||||||||||||||||||||||||||||||||
| Wilshire 5000 | 11225.8 | 5.37% | -2.36% | Down | ||||||||||||||||||||||||||||||||||||
1The Market Signal is derived from our proprietary
market model. The market model is described on the site. 2The site also shows industry rankings based on fundamentals, combined technical and fundamentals, and on price alone. The site also shows daily industry movements. |
||||||||||||||||||||||||||||||||||||||||
# of Breakouts |
Period Average1 |
Max. Gain During Period2 |
Gain at Period Close3 |
|
|---|---|---|---|---|
| This Week | 5 | 8.23 | 2.92% | 1.78% |
| Last Week | 4 | 9.31 | 5.99% | 4.48% |
| 13 Weeks | 119 | 9.62 | 14.85% |
-3.57% |
2This represents the return if each stock were bought at its breakout price and sold at its intraday high.
3This represents the return if each stock were bought at its breakout price and sold at the most recent close.
Category |
Symbol |
Company Name |
Expected Gain1 |
|---|---|---|---|
| Best Overall | GGAL | Grupo Financiero Galicia S.A. | 120 |
| Top Technical | NTL | Nortel Inversora S.A. | 53 |
| Top Fundamental | LULU | Lululemon Athletica Inc. | 59 |
| Top Tech. & Fund. | LULU | Lululemon Athletica Inc. | 59 |
Category |
Symbol |
Company Name |
Expected Gain1 |
|---|---|---|---|
| Best Overall | VIT | VanceInfo Technologies Inc. | 63 |
| Top Technical | SUSS | Susser Holdings Corporation | 50 |
| Top Fundamental | VIT | VanceInfo Technologies Inc. | 63 |
| Top Tech. & Fund. | VIT | VanceInfo Technologies Inc. | 63 |
If you received this newsletter from a friend and you would like to receive it regularly please go to the BreakoutWatch.com site and enter as a Guest. You will then be able to register to receive the newsletter.
Copyright © 2010 NBIcharts, LLC dba BreakoutWatch.com.
All rights reserved.
"
BreakoutWatch," the BreakoutWatch.com "eye" logo, and the
slogan "tomorrow's breakouts today" are service marks of NBIcharts
LLC. All other marks are the property of their respective owners, and are
used for descriptive purposes only.
BreakoutWatch is not affiliated with Investor's Business Daily or with Mr. William O'Neil.
Our site, research and analysis is supported entirely by subscription and is free from advertising.