| Market Summary | Weekly Breakout Report | Top Breakout Choices | Top 2nd Chances | New Features | Tip of the Week |
The
markets closed the week on a big rally with the major indexes recording
an accumulation day but were still negative for the week. The markets
took heart after Fed Chairman Bernanke glossed over dismal economic
news, which downgraded second quarter growth to 1.6% from a previous
estimate of 2.4%, and said that "Should further
action prove necessary, policy options are available". The downward
revision to GDP, and continuing high unemployment, makes it
clear that further action is necessary, so why is the Fed so reluctant
to undertake those policy actions now?
The NASDAQ chart shows that Wednesday was a reversal day in that it closed higher after setting a local intraday low. O'Neil (CAN SLIM) followers consider this as a possible sign of a market bottom and look for a "follow through" day on the fourth through twelfth day after the reversal. As Wednesday counts as the first day, that means a follow through day could occur as early as Monday.
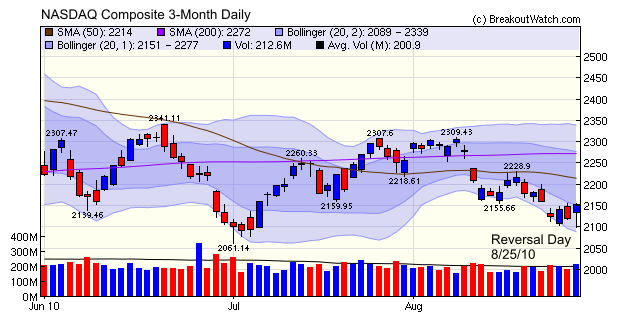
While a short term bounce in the markets is possible, I believe the underlying trend remains downwards, so beware that a follow through day could be a "bull trap". Consumer spending is the key to the recovery. When the Consumer Metrics Institute's "Contraction Watch" indicator starts to trend upwards then we can have some measure of faith that a recovery is just a few weeks away. Unfortunately, the latest measures indicate the "Daily Growth Index has reached a year-over-year contraction rate of 5%, and it is rapidly closing the gap on the worst contraction rate observed during the 2008 Great Recession". In other words, the economy is heading towards another 2008 like recession.
The NASDAQ chart shows that Wednesday was a reversal day in that it closed higher after setting a local intraday low. O'Neil (CAN SLIM) followers consider this as a possible sign of a market bottom and look for a "follow through" day on the fourth through twelfth day after the reversal. As Wednesday counts as the first day, that means a follow through day could occur as early as Monday.
While a short term bounce in the markets is possible, I believe the underlying trend remains downwards, so beware that a follow through day could be a "bull trap". Consumer spending is the key to the recovery. When the Consumer Metrics Institute's "Contraction Watch" indicator starts to trend upwards then we can have some measure of faith that a recovery is just a few weeks away. Unfortunately, the latest measures indicate the "Daily Growth Index has reached a year-over-year contraction rate of 5%, and it is rapidly closing the gap on the worst contraction rate observed during the 2008 Great Recession". In other words, the economy is heading towards another 2008 like recession.
No new features this week.
This feature will return after Labor Day.
| Index | Value | Change Week | Change YTD | Trend | ||||||||||||||||||||||||||||||||||||
|---|---|---|---|---|---|---|---|---|---|---|---|---|---|---|---|---|---|---|---|---|---|---|---|---|---|---|---|---|---|---|---|---|---|---|---|---|---|---|---|---|
| Dow | 10150.7 | -0.62% | -2.66% | Up | ||||||||||||||||||||||||||||||||||||
| NASDAQ | 2153.63 | -1.2% | -5.09% | Down | ||||||||||||||||||||||||||||||||||||
| S&P 500 | 1064.59 | -0.66% | -4.53% | Down | ||||||||||||||||||||||||||||||||||||
| Russell 2000 | 616.76 | 0.98% | -2.73% | Down | ||||||||||||||||||||||||||||||||||||
| Wilshire 5000 | 11097.6 | -0.48% | -3.48% | Down | ||||||||||||||||||||||||||||||||||||
1The Market Signal is derived from our proprietary
market model. The market model is described on the site. 2The site also shows industry rankings based on fundamentals, combined technical and fundamentals, and on price alone. The site also shows daily industry movements. |
||||||||||||||||||||||||||||||||||||||||
# of Breakouts |
Period Average1 |
Max. Gain During Period2 |
Gain at Period Close3 |
|
|---|---|---|---|---|
| This Week | 15 | 11.38 | 3.85% | 2.47% |
| Last Week | 11 | 10.62 | 7.75% | 2.17% |
| 13 Weeks | 149 | 11.46 | 10.91% |
1.4% |
2This represents the return if each stock were bought at its breakout price and sold at its intraday high.
3This represents the return if each stock were bought at its breakout price and sold at the most recent close.
Category |
Symbol |
Company Name |
Expected Gain1 |
|---|---|---|---|
| Best Overall | RQI | Cohen & Steers Quality Income Realty Fund Inc. | 118 |
| Top Technical | TPCG | 55 | |
| Top Fundamental | SQM | Chemical & Mining Co. of Chile Inc. | 39 |
| Top Tech. & Fund. | SQM | Chemical & Mining Co. of Chile Inc. | 39 |
Category |
Symbol |
Company Name |
Expected Gain1 |
|---|---|---|---|
| Best Overall | ABBC | Abington Bancorp Inc. | 64 |
| Top Technical | BAK | Braskem S.A. | 58 |
| Top Fundamental | WCRX | Warner Chilcott plc | 47 |
| Top Tech. & Fund. | WCRX | Warner Chilcott plc | 47 |
If you received this newsletter from a friend and you would like to receive it regularly please go to the BreakoutWatch.com site and enter as a Guest. You will then be able to register to receive the newsletter.
Copyright © 2010 NBIcharts, LLC dba BreakoutWatch.com.
All rights reserved.
"
BreakoutWatch," the BreakoutWatch.com "eye" logo, and the
slogan "tomorrow's breakouts today" are service marks of NBIcharts
LLC. All other marks are the property of their respective owners, and are
used for descriptive purposes only.
BreakoutWatch is not affiliated with Investor's Business Daily or with Mr. William O'Neil.
Our site, research and analysis is supported entirely by subscription and is free from advertising.