| Market Summary | Weekly Breakout Report | Top Breakout Choices | Top 2nd Chances | New Features | Tip of the Week |
We welcome several new subscribers this week. This would appear to
reflect a growing confidence among the self-directed investor community
that the summer bear market is approaching its end. Let's hope this is
so!
For their benefit, let me remind everyone that our weekly newsletter usually starts out with a review of the NASDAQ Composite chart as most breakouts come from that market. We typically look at the 6-month daily candlestick chart with a Bollinger Bands overlay for 1 and 2 standard deviations, and the 50 and 200 day simple moving averages.
This week, we are going to vary that scenario slightly by showing the 50 day (red) and 10 day (blue) exponential moving averages. This is because these two moving averages are inputs to our market trend model. When the 10 day ema is above the 50 day ema then our model considers the trend to be up, and when the 10 day ema is below the 50 day ema, the trend is down.
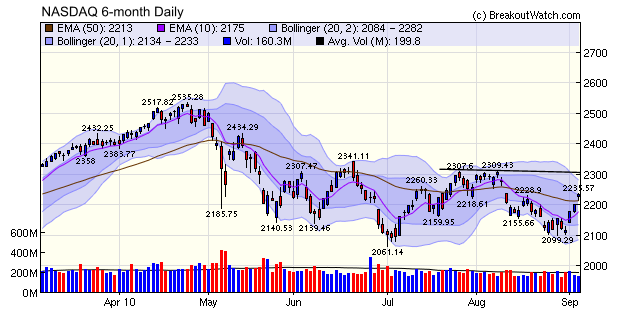
You can see that the sizable upward moves on Thursday and Friday were on light volume so we would like to see stronger volume when the markets open next Tuesday to confirm the trend. However, we can see that if the upward trend continues we are still a couple of sessions away from our trend model turning positive. If so, the index will encounter resistance at 2310 and a break out above that level would confirm a new bullish phase.
The number of breakouts jumped to double the 13 week average this week with an average gain after breakout that beat the market averages. If volume had been closer to the 50 day average on Thursday and Friday there would have been many more.
For their benefit, let me remind everyone that our weekly newsletter usually starts out with a review of the NASDAQ Composite chart as most breakouts come from that market. We typically look at the 6-month daily candlestick chart with a Bollinger Bands overlay for 1 and 2 standard deviations, and the 50 and 200 day simple moving averages.
This week, we are going to vary that scenario slightly by showing the 50 day (red) and 10 day (blue) exponential moving averages. This is because these two moving averages are inputs to our market trend model. When the 10 day ema is above the 50 day ema then our model considers the trend to be up, and when the 10 day ema is below the 50 day ema, the trend is down.
You can see that the sizable upward moves on Thursday and Friday were on light volume so we would like to see stronger volume when the markets open next Tuesday to confirm the trend. However, we can see that if the upward trend continues we are still a couple of sessions away from our trend model turning positive. If so, the index will encounter resistance at 2310 and a break out above that level would confirm a new bullish phase.
The number of breakouts jumped to double the 13 week average this week with an average gain after breakout that beat the market averages. If volume had been closer to the 50 day average on Thursday and Friday there would have been many more.
We wish all our readers a happy and safe Labor Day Weekend.
No new features this week.
This feature wil return next week.
| Index | Value | Change Week | Change YTD | Trend | ||||||||||||||||||||||||||||||||||||
|---|---|---|---|---|---|---|---|---|---|---|---|---|---|---|---|---|---|---|---|---|---|---|---|---|---|---|---|---|---|---|---|---|---|---|---|---|---|---|---|---|
| Dow | 10447.9 | 2.93% | 0.19% | Up | ||||||||||||||||||||||||||||||||||||
| NASDAQ | 2233.75 | 3.72% | -1.56% | Down | ||||||||||||||||||||||||||||||||||||
| S&P 500 | 1104.51 | 3.75% | -0.95% | Down | ||||||||||||||||||||||||||||||||||||
| Russell 2000 | 643.36 | 4.31% | 1.47% | Down | ||||||||||||||||||||||||||||||||||||
| Wilshire 5000 | 11524.8 | 3.85% | 0.24% | Down | ||||||||||||||||||||||||||||||||||||
1The Market Signal is derived from our proprietary
market model. The market model is described on the site. 2The site also shows industry rankings based on fundamentals, combined technical and fundamentals, and on price alone. The site also shows daily industry movements. |
||||||||||||||||||||||||||||||||||||||||
# of Breakouts |
Period Average1 |
Max. Gain During Period2 |
Gain at Period Close3 |
|
|---|---|---|---|---|
| This Week | 27 | 13.23 | 6.01% | 4.64% |
| Last Week | 16 | 11.38 | 5.69% | 3.08% |
| 13 Weeks | 175 | 13.46 | 11.07% |
5.3% |
2This represents the return if each stock were bought at its breakout price and sold at its intraday high.
3This represents the return if each stock were bought at its breakout price and sold at the most recent close.
Category |
Symbol |
Company Name |
Expected Gain1 |
|---|---|---|---|
| Best Overall | NGD | New Gold, Inc. | 109 |
| Top Technical | TPCG | TPC Group, inc. |
48 |
| Top Fundamental | HEI | HEICO Corp. | 31 |
| Top Tech. & Fund. | HEI | HEICO Corp. | 31 |
Category |
Symbol |
Company Name |
Expected Gain1 |
|---|---|---|---|
| Best Overall | EDR | Education Realty Trust Inc. | 86 |
| Top Technical | SHS | Sauer-Danfoss Inc. | 61 |
| Top Fundamental | CASY | Casey's General Stores Inc. | 49 |
| Top Tech. & Fund. | CASY | Casey's General Stores Inc. | 49 |
If you received this newsletter from a friend and you would like to receive it regularly please go to the BreakoutWatch.com site and enter as a Guest. You will then be able to register to receive the newsletter.
Copyright © 2010 NBIcharts, LLC dba BreakoutWatch.com.
All rights reserved.
"
BreakoutWatch," the BreakoutWatch.com "eye" logo, and the
slogan "tomorrow's breakouts today" are service marks of NBIcharts
LLC. All other marks are the property of their respective owners, and are
used for descriptive purposes only.
BreakoutWatch is not affiliated with Investor's Business Daily or with Mr. William O'Neil.
Our site, research and analysis is supported entirely by subscription and is free from advertising.