| Market Summary | Weekly Breakout Report | Top Breakout Choices | Top 2nd Chances | New Features | Tip of the Week |
Our Friday newsletter prep time disappeared down a wormhole as we tracked down an elusive bug in the alerts process. It was adding spurious symbols when subscribers requested alerts on both their PWL's and filtered watchlists and took a heck of a long time to track down. Hopefully it's now resolved.
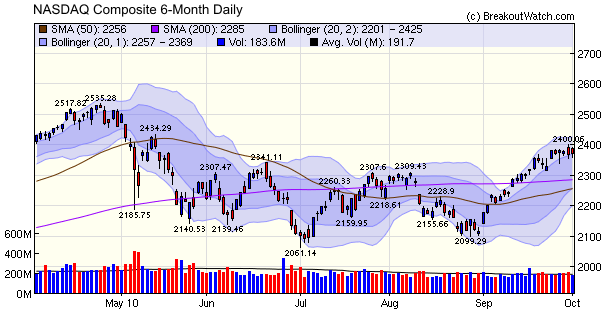
A quick look at the NASDAQ chart shows just how steep the gains were in September as it quickly reversed course and then tracked the upper Bollinger Band before pausing for breath around 9/20. The small losses for the week by the major indexes show that we are now in a period of consolidation but still with an upward bias. The noises coming from the FRBNY's William Dudley that “Further action is likely to be warranted unless the economic outlook evolves in a way that makes me more confident that we will see better outcomes for both employment and inflation before too long” makes it almost certain that the markets will continue to rise as there is no doubt that further action is certainly warranted.
Not really a new feature, but one we have decided to resurrect - our CwH Chart Selector.
This tool allows you to look for CwH patterns that fall outside our standard selection criteria. For example, you may want to look for longer, deeper cups, or handles higher than our 3% above left cup limit.
Did you see a pattern that you thought should have been included on our CwH list? Then enter a symbol into this tool and we'll tell you why it didn't qualify.
Beware - this tool uses lots of CPU and memory resources (on our system, not yours) so we only allow it to be used outside market hours.
The tool is accessed from the Mine for Candidates > Long Positions menu choice.
< this week's Tip >
| Index | Value | Change Week | Change YTD | Trend | ||||||||||||||||||||||||||||||||||||
|---|---|---|---|---|---|---|---|---|---|---|---|---|---|---|---|---|---|---|---|---|---|---|---|---|---|---|---|---|---|---|---|---|---|---|---|---|---|---|---|---|
| Dow | 10829.7 | -0.28% | 3.85% | Up | ||||||||||||||||||||||||||||||||||||
| NASDAQ | 2370.75 | -0.44% | 4.48% | Up | ||||||||||||||||||||||||||||||||||||
| S&P 500 | 1146.24 | -0.21% | 2.79% | Up | ||||||||||||||||||||||||||||||||||||
| Russell 2000 | 679.29 | 1.23% | 7.13% | Up | ||||||||||||||||||||||||||||||||||||
| Wilshire 5000 | 11998.7 | 0.06% | 4.36% | Up | ||||||||||||||||||||||||||||||||||||
1The Market Signal is derived from our proprietary
market model. The market model is described on the site. 2The site also shows industry rankings based on fundamentals, combined technical and fundamentals, and on price alone. The site also shows daily industry movements. |
||||||||||||||||||||||||||||||||||||||||
# of Breakouts |
Period Average1 |
Max. Gain During Period2 |
Gain at Period Close3 |
|
|---|---|---|---|---|
| This Week | 35 | 21.15 | 4.66% | 1.28% |
| Last Week | 38 | 18.38 | 8.55% | 4.71% |
| 13 Weeks | 279 | 21.85 | 13.82% |
8.82% |
2This represents the return if each stock were bought at its breakout price and sold at its intraday high.
3This represents the return if each stock were bought at its breakout price and sold at the most recent close.
Category |
Symbol |
Company Name |
Expected Gain1 |
|---|---|---|---|
| Best Overall | OWW | Orbitz Worldwide, Inc. | 111 |
| Top Technical | CLU | Celu Tissue Holdings, Inc. |
55 |
| Top Fundamental | LULU | Lululemon Athletica Inc. | 47 |
| Top Tech. & Fund. | LULU | Lululemon Athletica Inc. | 47 |
Category |
Symbol |
Company Name |
Expected Gain1 |
|---|---|---|---|
| Best Overall | BTN | Ballantyne Strong, Inc | 91 |
| Top Technical | EXXI | Energy XXI (Bermuda) Limited | 62 |
| Top Fundamental | LULU | Lululemon Athletica Inc. | 47 |
| Top Tech. & Fund. | LULU | Lululemon Athletica Inc. | 47 |
If you received this newsletter from a friend and you would like to receive it regularly please go to the BreakoutWatch.com site and enter as a Guest. You will then be able to register to receive the newsletter.
Copyright © 2010 NBIcharts, LLC dba BreakoutWatch.com.
All rights reserved.
"
BreakoutWatch," the BreakoutWatch.com "eye" logo, and the
slogan "tomorrow's breakouts today" are service marks of NBIcharts
LLC. All other marks are the property of their respective owners, and are
used for descriptive purposes only.
BreakoutWatch is not affiliated with Investor's Business Daily or with Mr. William O'Neil.
Our site, research and analysis is supported entirely by subscription and is free from advertising.